Download

1 / 7
80 likes | 172 Views
Option C: Regression Analysis. NDM Data Sample. Data collation. Raw data ranging from March 2005 to March 2011. Gas consumption at Small Supply Points ( i.e. , EUC 1,2,3 and 4), contained in “ SMNDM_AQ_ xxxx .txt ” files, was aggregated by EUC, LDZ and by day.

E N D
Option C: Regression Analysis NDM Data Sample
Data collation • Raw data ranging from March 2005 to March 2011. • Gas consumption at Small Supply Points (i.e., EUC 1,2,3 and 4), contained in “SMNDM_AQ_xxxx.txt” files, was aggregated by EUC, LDZ and by day. • No data at LDZ WN for EUC 1. • At LDZ NW, data ranging from 23rd March 2009 to 20th October 2009 missing. • No data yet collated for Large Supply Points.
Data Cleansing • Due to overlapping time windows below, incoherent data were removed as collectively agreed on 2nd May • At LDZ NW, further data deleted due to sudden doubling in consumption (i.e., outliers). Dates range from 17th March 2009 to 21st October 2009. Total of 7 data points removed.
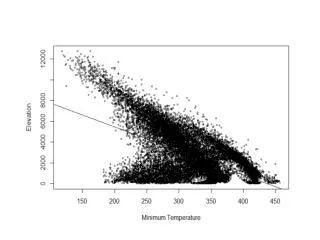
Regression Analysis • Regression Model as follows: • Dummy variables (Bank Holidays, Easter, Christmas and so forth). • Weather variables introduced as per DESC meeting on 4th April (e.g. Temperature, Global Radiation, Rainfall and so forth). • Time intervals used based on office hours and domestic habits. • Slot 1 from 5am to 8am • Slot 2 from 9am to 4pm • Slot 3 from 5pm to 10pm • Slot 4 from 11pm to 4am
Regression Analysis • Data normalised by AQ because of erratic level changes observed year on year. Yearly cut-off date is of 1st April due to time span of original files and data deletion process • Permutation of 14 Variables used to seek out best Regression fit.
Conclusion • MAPE of 10% overall across all LDZ’s. • Over Winter months (October-April), overall MAPE is of 8%. • Over Summer months (May-September), overall MAPE of 13.5%. • Regression analysis suggests that, overall, these variables are significant: • Mean_WindDirection • Slot1_Windspeed • Slot3_Windspeed • Slot3_GlobalRadiation • Slot4_Temp • Bank Holidays • School Holidays • CWV • mean_Temp • mean_Rainfall
Discussion of future work • Removal of non-significant parameters and fine-tuning of regression analysis. • For LDZ NW, weather parameters missing. Weather substitution algorithm to be implemented? • Lagged weather effects may be introduced. • Investigation of power on explanatory variables. • Out-of-sample modelling upon receipt of 2011/2012 NDM Sample Data