Download
1 / 13
130 likes | 251 Views
Option C: Regression Analysis. Summary of NDM Data Sample Analysis. Contents. Regression Analysis per LDZ In-Sample Results Out-of-Sample Model fit CWV Contribution Conclusion. Regression Analysis. Regression Model as follows:

E N D
Option C: Regression Analysis Summary of NDM Data Sample Analysis
Contents • Regression Analysis per LDZ • In-Sample Results • Out-of-Sample Model fit • CWV Contribution • Conclusion
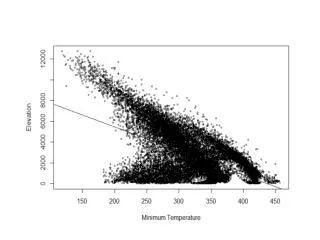
Regression Analysis • Regression Model as follows: • Dummy variables (Bank Holidays, Easter, Christmas and so forth). • Weather variables introduced as per DESC meeting on 4th April (e.g. Temperature, Global Radiation, Rainfall and so forth). • Time intervals used based on office hours and domestic habits. • Slot 1 from 5am to 8am • Slot 2 from 9am to 4pm • Slot 3 from 5pm to 10pm • Slot 4 from 11pm to 4am
Regression Analysis • Data normalised by AQ because of erratic level changes observed year on year. Yearly cut-off date is of 1st April due to time span of original files and data deletion process • Binary permutation of variables used to seek out best regression fit with p≤5% significance level.
Regression Analysis Models used • A benchmark model was used for each LDZ as the following: • Normalised Consumption= Intercept + a0 * CWV • Using Binary permutations, a most optimised linear regression model (based on best R2 fit) is chosen. The linear regression is of the form: • Normalised Consumption= Intercept + a0 * CWV + a1 * Temperature + a2* Windspeed + a3* Solar Radiation + … • In-Sample data runs from April 2008 to March 2011 whereas Out-of-Sample data spans from April 2011 to March 2012. • These models were applied to End-User Category 1 only (EUC1).
Conclusion • Improvements against Benchmark Results are made using weather and/or calendar effects on top of CWV. • The significance, or non-significance, level of Weekend/Weekday/Bank Holiday is very much LDZ-specific. • Global Radiation is a significant variable in all LDZ’s. • Time Intervals (i.e., Slot 1 to 4) and Monday-to-Thursday dummy variable help explain customer behaviour in some LDZ’s. • Relative Humidity stands out in almost every LDZ’s. • CWV heavily contributes in the optimised models obtained. • No cross-effects utilised in Regression models. • LDZ SO and NT need further investigations