Download
1 / 9
90 likes | 100 Views
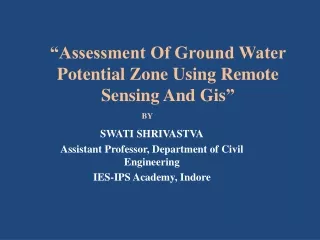
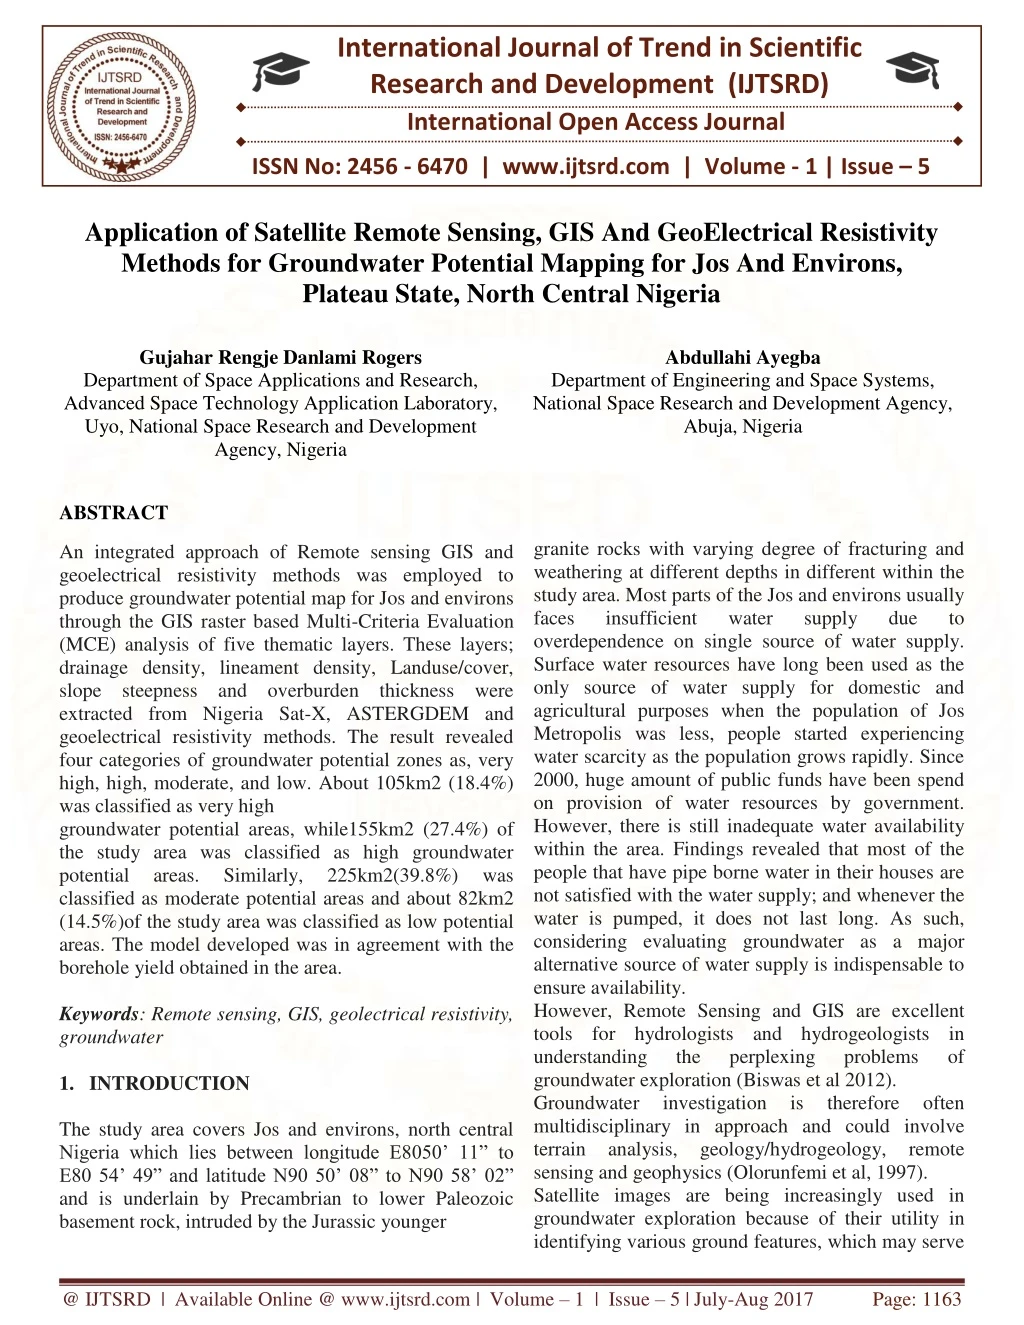
An integrated approach of Remote sensing GIS and geoelectrical resistivity methods was employed to produce groundwater potential map for Jos and environs through theGISraster based Multi Criteria Evaluation MCE analysis of five thematic layers. These layers drainage density, lineament density, Landuse cover, slope steepness and overburden thickness wereextractedfrom Nigeria Sat X, ASTERGDEM and geoelectrical resistivity methods. The result revealed four categories of groundwater potential zones as, very high, high, moderate, and low. About 105km2 18.4 was classified as very high groundwater potential areas, while155km2 27.4 of the study area was classified as high groundwater potential areas. Similarly, 225km2 39.8 was classified as moderate potential areas and about 82km2 14.5 of the study area was classified as low potential areas. The model developed was in agreement with the borehole yield obtained in the area. Gujahar Rengje Danlami Rogers | Abdullahi Ayegba "Application of Satellite Remote Sensing, GIS and Geoelectrical Resistivity Methods for Groundwater Potential Mapping for Jos and Environs, Plateau State, North Central Nigeria" Published in International Journal of Trend in Scientific Research and Development (ijtsrd), ISSN: 2456-6470, Volume-1 | Issue-5 , August 2017, URL: https://www.ijtsrd.com/papers/ijtsrd2452.pdf Paper URL: http://www.ijtsrd.com/other-scientific-research-area/other/2452/application-of-satellite-remote-sensing-gis-and-geoelectrical-resistivity-methods-for-groundwater-potential-mapping-for-jos-and-environs-plateau-state-north-central-nigeria/gujahar-rengje-danlami-rogers<br>

E N D
International Journal of Trend in Scientific Research and Development (IJTSRD) International Open Access Journal ISSN No: 2456 - 6470 | www.ijtsrd.com | Volume - 1 | Issue – 5 Application of Satellite Remote Sensing, GIS And GeoElectrical Resistivity Methods for Groundwater Potential Mapping for Jos And Environs, Plateau State, North Central Nigeria Gujahar Rengje Danlami Rogers Department of Space Applications and Research, Advanced Space Technology Application Laboratory, Uyo, National Space Research and Development Agency, Nigeria Abdullahi Ayegba Department of Engineering and Space Systems, National Space Research and Development Agency, Abuja, Nigeria ABSTRACT granite rocks with varying degree of fracturing and weathering at different depths in different within the study area. Most parts of the Jos and environs usually faces insufficient water overdependence on single source of water supply. Surface water resources have long been used as the only source of water supply for domestic and agricultural purposes when the population of Jos Metropolis was less, people started experiencing water scarcity as the population grows rapidly. Since 2000, huge amount of public funds have been spend on provision of water resources by government. However, there is still inadequate water availability within the area. Findings revealed that most of the people that have pipe borne water in their houses are not satisfied with the water supply; and whenever the water is pumped, it does not last long. As such, considering evaluating groundwater as a major alternative source of water supply is indispensable to ensure availability. However, Remote Sensing and GIS are excellent tools for hydrologists and hydrogeologists in understanding the perplexing groundwater exploration (Biswas et al 2012). Groundwater investigation multidisciplinary in approach and could involve terrain analysis, geology/hydrogeology, remote sensing and geophysics (Olorunfemi et al, 1997). Satellite images are being increasingly used in groundwater exploration because of their utility in identifying various ground features, which may serve An integrated approach of Remote sensing GIS and geoelectrical resistivity methods was employed to produce groundwater potential map for Jos and environs through the GIS raster based Multi-Criteria Evaluation (MCE) analysis of five thematic layers. These layers; drainage density, lineament density, Landuse/cover, slope steepness and overburden thickness were extracted from Nigeria Sat-X, ASTERGDEM and geoelectrical resistivity methods. The result revealed four categories of groundwater potential zones as, very high, high, moderate, and low. About 105km2 (18.4%) was classified as very high groundwater potential areas, while155km2 (27.4%) of the study area was classified as high groundwater potential areas. Similarly, classified as moderate potential areas and about 82km2 (14.5%)of the study area was classified as low potential areas. The model developed was in agreement with the borehole yield obtained in the area. Keywords: Remote sensing, GIS, geolectrical resistivity, groundwater 1.INTRODUCTION The study area covers Jos and environs, north central Nigeria which lies between longitude E8050’ 11” to E80 54’ 49” and latitude N90 50’ 08” to N90 58’ 02” and is underlain by Precambrian to lower Paleozoic basement rock, intruded by the Jurassic younger supply due to 225km2(39.8%) was problems of is therefore often @ IJTSRD | Available Online @ www.ijtsrd.com | Volume – 1 | Issue – 5 | July-Aug 2017 Page: 1163
International Journal of Trend in Scientific Research and Development (IJTSRD) ISSN: 2456-6470 either as direct or indirect indicators of groundwater potential. An integrated remote sensing and GIS study can provide the appropriate platform for convergent analysis of large volumes multidisciplinary data and decision making for groundwater studies. The electrical resistivity method is the most promising and relevant geophysical method applied in groundwater exploration (Offodile, 2006).Any basement rock resistivity exceeding 3000 ohm-m can be thought of as representing fresh basement rock containing little or no water (Olayinka et al 1996). 4. 4.1 Materials Satellite data (Nigeria Sat-X, ASTERGDEM) and electrical resistivity data, ArcGIS 10.5 and IPI 2 WIN softwares were used for the study. 4.2 Method The satellite data were subjected to digital image processing for the extraction of linear features (including rivers and lineaments).These linear features were analyzed using the inverse distance weighted (IDW) of spatial analysis method. The VES data were quantitatively interpreted using IPI2WIN geophysical thicknesses were generated from VES interpretation result and were subjected to IDW tool of spatial analysis extension. The land use/cover was produced using the maximum likelihood algorithm of supervised classification method. Five thematic maps (lineament density, drainage density, slope, landuse/cover, overburden thickness,) were prepared and their individual influence on ground water systematically determined by assigning weight. The thematic layers were subjected to Multi-Criteria Overlay analysis in ArcGIS 10.5 environment in order to delineate the various groundwater potential zones. Finally groundwater potential map was generated based on the GIS analyses. The reliability of the groundwater potential map was validated against the borehole yield data. 5. GEOLOGY AND HYDROGEOLOGY The study area is covered by the Jurassic younger granite complexes which intruded the crystalline Precambrian Basement complex rock and overlies by the newer and older basalts. With respect to groundwater occurrences and availability, these rock units weathered and fractured at depth to form the overburden which are very thick in some places and thin out in other places. However, the degree of weathering and fracturing varies with different rock types. However, the combination of the weathered overburden and fractured rocks yield very high amount of groundwater. overburden and fractured rocks has the potential of hosting groundwater which varies in yields depending on the thickness of the overburden and the extent of fracturing. The weathered profile developed above crystalline comprises, from top to bottom, the soil layer, the saprolite (product of in situ chemical weathering of MATERIALS AND METHOD of 2. STUDY AREA The study area is located in Jos north Local Government area and Jos South Local Government area, Plateau state, north central Nigeria as shown in (Fig.1). The state is bounded by Bauchi, Kaduna, Nasarawa and Taraba,States The accessibility of the study area is best described in terms of transportation network, which consists of major and minor roads with foot paths across the whole area. The average elevation of the study area is about 1,300m above mean sea level, with the younger granite rocks rising above this surface. The relief of the study area determines and controls the flow of the river systems as well as groundwater hydrology.The Younger Granites generally give rise to rugged topography with steep rocky hills joint- controlled valleys. The basement rocks generally form low lying, poorly exposed areas, except where they are dissected in the vicinity of the Plateau margins. The Jos- Bukuru complex and the Naraguta hill formed the prominent hills in the study area while the basement rocks form the low-lying areas. software. Overburden These weathered basement rocks Fig1: Plateau state showing the study area @ IJTSRD | Available Online @ www.ijtsrd.com | Volume – 1 | Issue – 5 | July-Aug 2017 Page: 1164
International Journal of Trend in Scientific Research and Development (IJTSRD) ISSN: 2456-6470 the bedrock), the saprock (fractured bedrock), and the fresh bedrockOlayinka (1996). 6. A total of 115vertical electrical soundings (VES) using the Schlumberger configuration and current electrode spacing of (AB/2) 200m was employed for the study. The depth and resistivity of the subsurface layers were determined. The interpreted results of the geo electrical sections indicates the presence of four subsurface layers: top soil of thickness and resistivity values ranging from 169 – 728 ohms metre, weathered basement ranging from 100 – 314 ohms meter, fractured basement ranging from 350 - 496 ohms meter, the fresh rock bedrock ranging from 1000ohms metre to infinity. 7. GENERATION OF THEMATIC LAYERS 7.1 Drainage Network The drainage network of the study area was derived from ASTERGDEM data, the major rivers present in the study area runs from southwest to northeast. All the small river and large rivers, which are found in the study area drain from central part to east and west direction. Comparison of the drainage system of the area and lineament orientation of the area has shown that the drainage system of the area is structurally controlled as shown in Figure 2.2following lineaments directions. Dendritic and parallel drainage pattern are recognized in the area as shown in Figure 2.1, which are indicative of the presence of structures that act as conduits or storage for sub-surface water. Vertical Electrical Sounding (VES) Fig. 2.2: Drainage and lineament orientation 7.2 Drainage Density The drainage density in the study area was derived in ArcGIS using kernel density method of the spatial analyst extension tool. Five drainage density categories have been identified and mapped out as shown in Figure 3.1. Very high drainage density is found in the western, eastern and northeastern part of the project area whereas high drainage density is found scattered in all parts of the study area. Moderate and low drainage density concentrates in the southern and central part of the project area. On the other hand, high drainage density has also been observed as an important influencing factor of groundwater potential in the Basement Complex terrain (Akinwumiju, 2015). This is because shallow (mostly unconfined) aquifers are being recharged by river inflows particularly during the dry season. In groundwater studies, drainage density map could be analyzed, either as an indicator of groundwater potential or as an inverse index of infiltration potential. The drainage density was reclassified and assigned weight with respect to influences of groundwater occurrences. Fig. 2.1: Drainage network @ IJTSRD | Available Online @ www.ijtsrd.com | Volume – 1 | Issue – 5 | July-Aug 2017 Page: 1165
International Journal of Trend in Scientific Research and Development (IJTSRD) ISSN: 2456-6470 Fig 3.1: Drainage density Fig 4.1: Lineament extracted from NigeriaSat-X Rose Plot Azimuth Values Derived from Polylines in 'Lineament' N = 756 Values Weighted by Polyline Length Total Length = 768,343 Fig 3.2: Reclassified drainage density 7.3 Lineament Lineament are linear features in form of fold, fault, joints and fractures aligned in a rectilinear or slightly curvilinear relationship and which differ from the pattern of adjacent features and presumably reflect some subsurface phenomenon (Fig.4.1). Lineaments are zone of increased porosity and permeability, which in turn has greater significance in groundwater occurrence and distribution. In the imagery they were identified on the basis of break of slope, abrupt change in stream course, lithology, vegetation, and texture and drainage density. Lineaments in the study area were extracted from Nigeria Sat-X which consists of short and long structures as shown in Figure 4.1. Structural trend in the area are NE-SW majorly with some variations in the NW-SE direction as observed from the rose plot represented in Figure 4.2. The lineament mapping is aided by the existence of the geomorpho logical features such as aligned ridges and valleys, displacement of ridge lines, scarp faces and river passages, Straight drainage channel segments, pronounced breaks in crystalline rock masses, and aligned surface depressions (Hung et al 2005). Maximum Value = 40,714 0° 330° 30° 33,928 27,143 300° 60° 20,357 13,571 33,928 27,143 20,357 13,571 6,786 6,786 270° 90° 6,786 13,571 20,357 27,143 33,928 6,786 13,571 120° 240° 20,357 27,143 33,928 150° 210° 180° Fig 4.2: Rose plot of lineament orientation 7.4 Lineament Density The lineament density was calculated in ArcGIS 10.5 using the line density tool of the spatial analyst extension as shown in Figure 5.1. The analyses indicated that the area can be categorized into very high, high, moderate, low and very low density (Fig 5.1). With respect to groundwater potential, the zones of high to very high lineament intersection densities are feasible zones for groundwater prospecting in the study area than areas with very low lineament density. Thus lineaments act as conduits for groundwater flow and reservoir for groundwater storage in the crystalline rocks. The lineament density was reclassified with respect to groundwater feasibility in the area. @ IJTSRD | Available Online @ www.ijtsrd.com | Volume – 1 | Issue – 5 | July-Aug 2017 Page: 1166
International Journal of Trend in Scientific Research and Development (IJTSRD) ISSN: 2456-6470 Fig 5.1: Lineament density Fig 6.1: Land use /cover map Fig 5.2: Reclassified lineament density 7.5 Land Use/ Land Cover One of the parameters that influence the occurrence of sub-surface groundwater occurrence is the present condition of land cover and land use of the area. The effect of land use / cover is manifested either by reducing runoff and facilitating, or by trapping water on their leaf. Water droplets trapped in this way go down to recharge groundwater. Land use/cover may also affect groundwater negatively assuming interception to be constant. The land use/cover map of the area was readily interpreted from NIGSAT- Xby using visual interpretation and maximum likelihood algorithm classification as shown in Figure 6.1. Classification of land use/cover for analysis was done based on their character to infiltrate water in to the ground and to hold water on the ground. Generally built up area are found to be the least suitable for infiltration. Reclassified map was produced based on the weight as shown in Figure 6.2. Fig 6.2: Reclassified land use/cover map 7.6 Slope Steepness The slope of the study area generally ranges between 2 and 46degrees, indicating that the terrain of the study area is characterized by high and low topography (Fig 7.1). The slope map shows that favorable areas of high infiltration potential occur within various landform units in the study area. However, very low slope values were recorded for gently undulating terrain, which is an indicator of enhancing infiltration potential. Slope exerts its influence on groundwater potential by determining (to some extent) the rate of infiltration at any given location within a drain age basin ( Teixeira et al., by evapotranspiration, of supervised @ IJTSRD | Available Online @ www.ijtsrd.com | Volume – 1 | Issue – 5 | July-Aug 2017 Page: 1167
International Journal of Trend in Scientific Research and Development (IJTSRD) ISSN: 2456-6470 2008). In this case, the flatter the topography of al and surface, the greater the time lag for runoff. Generally, flat and gently sloping areas promote infiltration and groundwater recharge, and steeply sloping grounds encourage run-off and little or no infiltration. Groundwater potentiality is expected to be greater in the flat and gently sloping area (Solomon 2003). Flatter topography then will give more chance for groundwater accumulation. The slope derived in the area was reclassified with respect to groundwater accumulation as shown in Figure 7.2. to inverse distance weighted (IDW) spatial analysis in ArcGIS 10.5 version. It was found that the spatial variation of the overburden thickness for the study area ranged from 3.01m to 37.85m as shown in Figure8.1 which was reclassified with respect to groundwater occurrence and feasibility as shown in Figure 8.2. In crystalline terrain, groundwater development is promising mainly in areas with thick overburden (Olayinka et al 1997).The areas that are characterized by thick overburden are underlain coarse grain biotite granite, which is known for its extremely high groundwater potential if weathered. The groundwater potential of the Basement Complex terrain has been found to be highly dependent on over burden thickness particularly where rocks have not been significantly fractured (Ayoade, 1988; Olorunfemi, 1990). However, the groundwater potential of weathered layer largely physicochemical properties of the parent rocks. depends on the Fig 7.1: Slope in degrees Fig 8.1: Overburden thickness (m) Fig 7.2: Reclassified slope distribution 7.7 Overburden Thickness The overburden thickness is the depth from the surface to the underlying crystalline hard rock with very high resistivity values ranged from 1550 ohms- metre to 3500 ohms-metre. These overburden thickness values were deducted from vertical electrical sounding conducted in 115 locations across the study area, after being subjected to geophysical software interpretation IPI 2 WIN and are subjected @ IJTSRD | Available Online @ www.ijtsrd.com | Volume – 1 | Issue – 5 | July-Aug 2017 Page: 1168
International Journal of Trend in Scientific Research and Development (IJTSRD) ISSN: 2456-6470 This formula was modified by Musa et al., (2000) from DRASTIC model, which is used to assess ground water pollution Environmental Protection Agency of the United State of America. vulnerability by 9.RESULTS AND DISCUSSION Equation (1) was used to produce the groundwater potential map as shown in Figure 9.1. GPM model results were reclassified to four classes; very high, high, moderate and low groundwater potential area as shown in Figure 9.1. From the result of the study, hydro geologically it was observed that groundwater occurrence in the area is mainly localized within the secondary porosity that is the weathered overburden and fractured rocks of the medium to coarse grained biotite granites. Consequently, it was found that about 104km2representing18.4% of the study area was classified as very high potential areas. While about 155km2 representing 27.4% was classified as high potential areas. Also, about 225km2representing 39.8% of was classified as moderate potential areasandabout82km2 representing 14.5% of the study area was classified as low potential areas as shown from the histogram (Fig 10).The model generated was validated against the borehole yield data and it was found that yield obtained from borehole across very high, high, moderate and low groundwater potential areas yielded 2.5l/s to 4.2l/s, 1.8l/s to 2.5l/s, 1.0l/s to1.7l/s and 0.2l/s to 0.9l/s respectively (Fig 9.2). Fig 8.2: Reclassified overburden thickness 8. Groundwater Potential Model (GPM) A GIS model was developed using the Multi-Criteria Evaluation technique to generate the groundwater potential areas that are suitable for groundwater development. The determination of the groundwater potential value for the area was derived from the sum of the reclassified parameter weights (1-5) using Raster calculator tool of the spatial analysis extension in ArcGIS 10.5. The resulting cell values are added to produce the final output raster map that represents potential groundwater areas. Higher values represent a greater potential for groundwater. For a particular area being evaluated, each parameter classes were scaled on an evaluated scale according to their importance to other classes in the layer. The values were assigned in terms of their importance with respect to groundwater occurrences. Once each parameter has been assigned a scale value (suitable value) it is weighted. Weight values, from 1 to 5, express the relative importance of the parameter with respect to each other to groundwater occurrences. The formula of the GPMis given as; GPM= (Sw+LDw+DDw+LULCw+OTw)……….1 Where; w= weight ranking (1-5) S=Slope E=Digital Elevation LD=Lineament Density DD=Drainage Density LULC= Land cover types OT= Overburden Thickness Fig 9.1: Groundwater potential map @ IJTSRD | Available Online @ www.ijtsrd.com | Volume – 1 | Issue – 5 | July-Aug 2017 Page: 1169
International Journal of Trend in Scientific Research and Development (IJTSRD) ISSN: 2456-6470 development of any crystalline area. The model developed was in agreement with the borehole yield data. REFERENCES 1) Akinwumiju, A. S. (2015). GIS-Based IntegratedApproach PotentialAssessment Basin,Southwestern Nigeria. An UnpublishedPh.D. Thesis Submitted to the Institute ofEcology and Environmental Studies,ObafemiAwolowo University, Ile-Ife,Nigeria. 316pp 2) Ayoade, J. O. (1988). Tropical Hydrology andWater Resources. Macmillan. London 3) Biswas, A.K., Jana, A., Sharma, S. P. (2012): Delineation of Groundwater Potential Zones using Satellite Remote Sensingand Geographic Information SystemTechniques:A Case study from Ganjam district, Orissa, India Research Journal of Recent Sciences ISSN 2277-2502 66,September (2012) Res.J.Recent Sci. 4) Offodile, M.E. (2006): The Development and Management of Groundwater in Nigeria. In: A.A Elueze (ed.) Contributions of Geosciences and Mining to National Development, (NMGS), pp. 1- 7. 5) Olayinka, A.I., Akpan, E., Magbagbeola, O.A. (1997): Geoelectric Sounding for Estimating Aquifer Potential in the Crystalline Basement Area around Shaki, Southwest Resources8(1&2), 71-81. 6) Olorunfemi, M.O., Ojo, J.S., Akintunde, O.M. (1999): Hydrogeophysical Evaluation of the Groundwater Potential of Akure Metropolis, South- Western Nigeria.Journal of Mining and Geology 3(2), 207-228. 7) Solomon, S. (2003) Groundwater study using remote sensing and geographic information systems (GIS) in the central highlands of Eritrea. Doctoral Dissertation, Environmental and Natural Resources Information Systems, Royal Institute of Technology, Stockholm. 8) Teixeira, J.; Chamine, H. I.; Marques, J. E. (2008). Integrated Approach ofHydrogeomorphology and GIS Mappingto GroundwaterResources: An example from the Hydromineralsystem of NWPortugal. Glob.Groundw.Res Manag.Scientific Publishers, India, 227-249 to ofOsun Groundwater Drainage Fig 9.2: Validation of Groundwater potential map with borehole yield (l/s) Vol. 1(9), 59- Nigeria, Water Fig 10: Histogram showing groundwater potential areas (Sq.Km) CONCLUSION In this study, four categories of groundwater potential zones have been delineated based on integrated approach of Remote sensing, GIS and electrical resistivity techniques. The four categories are; very high, high, moderate and low. The groundwater potential map shows that Jos and environs is envisaged to be of moderate to high groundwater potential. Thus, it can be concluded that groundwater prospect is suitable for large scale groundwater development scheme to ameliorate the water scarcity experienced during the dry period for sustainability and economic development. It has been established successfully that Remote sensing, GIS and Geophysical techniques can provide the appropriate platform for convergent analysis of large volume of multi-disciplinary data and decision making for groundwater the Evaluation of Caldas Da Cavaca, exploration and @ IJTSRD | Available Online @ www.ijtsrd.com | Volume – 1 | Issue – 5 | July-Aug 2017 Page: 1170
International Journal of Trend in Scientific Research and Development (IJTSRD) ISSN: 2456-6470 BIOGRAPHIES Ayegba, a former associate lecturer with Kogi state College of Health Science and Tech., and an instructor of Space Science and Technology with National Centre Remote Sensing, Jos computer school, has published many academic textbooks as well as over twenty papers in International Journals. He presently works with the Engineering and Space Systems Dept. of NASRDA, Abuja, Nigeria. Ayegba is a member, International Society for Development and Sustainability (ISDC), Institute for Engineering Research and Publications (IFERP) and International Engineering and Technology (IAET). His areas of research interest are radio propagation, satellite communications, solar radiation &power system, Antennas, and Satellite power subsystem. Rogers RengjeDanlamiGujahar was born in 1974 at Bwai District, Mangu Local Government Area of Plateau State, Nigeria. He obtained B.Sc (Hons) Geology & Mining in 1997 and M.Sc in Hydrogeology &Engineering Geology in 2008. He further went to The Hebrew University of Jerusalem, Israel and obtained an International Post Graduate Diploma in Water Resources Management, Environmental Aspects and Risk Assessment in 2015. He is currently undergoing M.Phil/P.hD program Resources Planning in the Faculty of Environmental Sciences, University of Jos, Nigeria. He has worked as Exploration Geologist with the Nigerian Mining Corporation under Federal Ministry of Mines and Steel Development from 1999 to 2005, Self Sustaining Enterprise Water Supply Project (a US based NGO being resident in Nigeria) in 2008 as Project Officer, Federal Ministry of Mines and Steel Development as a Geologist, and Currently a Scientific Officer with the Advanced Space Technology Applications Laboratory under the aegis of National Space Research and Development Agency (NASRDA). He has worked as a consultant to different organizations. He is a member of Council of Mining Engineers and Geoscientists (COMEG), corporate member of the Nigerian Mining and Geosciences Society (MNMGS), member of the Nigerian Hydrogeologists (MNAH) and member of the International Association of Hydrogeologists (IAH). Association For in Environmental and Association of Abdullahi, Ayegba who was born in Okpachala- Igalamela, Kogi state, Nigeria, holds Elect/Elect Eng’g of Federal Polytechnic Idah, Kogi state, PGDE of NTI, Kaduna, PGD, Satellite Communication of ARCSSTEE, OUA Campus, Ile- Ife, and is currently awaiting the final defense for his masters in Space Science and Technology. HND, @ IJTSRD | Available Online @ www.ijtsrd.com | Volume – 1 | Issue – 5 | July-Aug 2017 Page: 1171