Download
1 / 21
210 likes | 300 Views
Methods for Estimating New Primary Production In Upwelling Systems James J. Bisagni University of Massachusetts, Dartmouth Physics Department & School for Marine Science & Technology New Bedford, Massachusetts, USA. Talk Outline: I. List Some Goals II. Provide Working Definitions

E N D
Methods for Estimating New Primary Production In Upwelling Systems James J. Bisagni University of Massachusetts, Dartmouth Physics Department & School for Marine Science & Technology New Bedford, Massachusetts, USA
Talk Outline: I. List Some Goals II. Provide Working Definitions III. Summary of Model Types IV. Model Descriptions V. Discussion
Tentative Project Goals: I. Describe the size of New Primary Production (NPP) in the Peru/Chile upwelling system II. Describe the mean seasonal cycle of NPP in the Peru/Chile upwelling system III. Describe interannual variability of NPP in the Peru/Chile upwelling system IV. Achieve goals I-III with a model-based approach, using both satellite and in-situ data
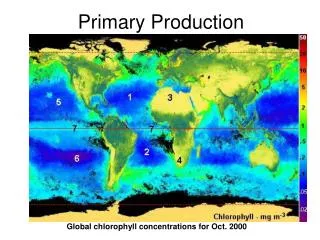
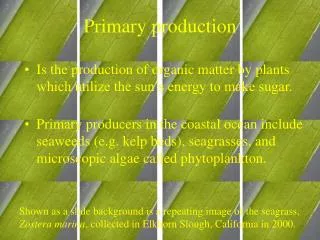
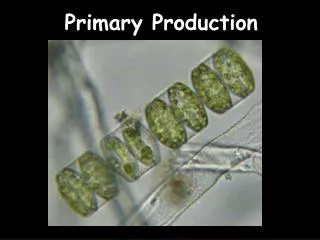
Total Primary Production Total primary production in the ocean may be divided into “new” and “regenerated” production based on the source of the nitrogen which is utilized. (Dugdale & Goering, 1967; Eppley & Peterson, 1979). Allocthonous nitrogen or nitrate (NO3)is inputinto the euphhotic zone from horizontal and/or vertical advection and diffusion. Autocthonous nitrogen or ammonium (NH4) is input in the euphotic zone from metabolic recycling caused by biota within the water column and sediments.
Importance of New Primary Production It is reasonable to state that in the absence of an allocthonous nitrogen supply, any given marine ecosystem will eventually become non-sustainable due to export of nitrogen through sinking of biogenic material and harvesting activities such as fishing, and predation from migratory pelagic species. (Platt et al., 1989) Thus, it is clear from the standpoints of the global ocean’s ability to sequester atmospheric CO2, along with a local region’s ability to maintain a sustainable ecosystem, that new primary production, rather than total primary production, is the key quantity.
Measurements of New Production Assimilation of 15N-labeled compounds allows instantaneous estimates of uptake rates of the available nitrogen sources by phytoplankton (Dugdale and Goering, 1967) and an estimate of the so-called “f-ratio” of new production to total production, where (Eppley and Peterson, 1979) However, estimates of regional or global new production must be done using other techniques such as using the relationship between new and total production and remotely-sensed data in order to discern how the presence of nitrogen species within the euphotic zone varies in space and time.
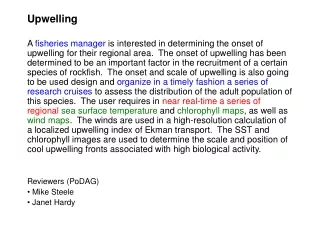
New Production Models 1) Nitrate Uptake (Shift-Up) Models Utilize the inverse relationship between temperature and nitrate and the physiological response of phytoplankton within the euphotic zone. ===> Largely “kinetics-based” Examples include: Dugdale et al., 1989, Northwest Africa Kudela & Dugdale, 1996, California Dugdale et al., 1997, California 2) Nitrate Bulk Models Utilize the inverse relationship between temperature and nitrate and a nitrate budget to account for the amount of nitrate within and entering the euphotic zone. ===> Largely “physics-based” Examples include: Waldron & Probyn, 1992, Benguela Townsend, 1998, Gulf of Maine Bisagni, in-press, Gulf of Maine
Nitrate Uptake (Shift-Up) Model (After Dugdale et al., 1989)
AVHRR (Only) Model (Left-Half) For Each Pixel Satellite SST Provides NO3
AVHRR (Only) Model (Left-Half) For Each Pixel Satellite SST Provides NO3 Satellite DSST Provides Time-Base
AVHRR (Only) Model (Left-Half) For Each Pixel Satellite SST Provides NO3 Satellite DSST Provides Time-Base Maximum measured specific NO3 uptake (Vmax NO3) at time=t assuming shift-up Shift-Up: Vmax NO3(t) = VNO3 (i) + A(t) x t Measured acceleration of NO3 uptake, d/dt(VNO3)
AVHRR (Only) Model (Left-Half) For Each Pixel Satellite SST Provides NO3 Satellite DSST Provides Time-Base Maximum measured specific NO3 uptake (Vmax NO3) at time=t assuming shift-up Predicted VNO3 at time=t assuming shift-up & Michaelis-Menton kinetics Shift-Up: Vmax NO3(t) = VNO3 (i) + A(t) x t Michaelis-Menton Kinetics: VNO3(t) = Vmax NO3(t) x [NO3]/(Ks + [NO3]) Measured half-saturation constant
AVHRR (Only) Model (Left-Half) For Each Pixel Satellite SST Provides NO3 Satellite DSST Provides Time-Base Maximum measured specific NO3 uptake (Vmax NO3) at time=t assuming shift-up Variation in VNO3 versus irradiance & depth of euphotic zone measurements (or from ocean color) Predicted VNO3 at time=t assuming shift-up & Michaelis-Menton kinetics Shift-Up: Vmax NO3(t) = VNO3 (i) + A(t) x t Michaelis-Menton Kinetics: VNO3(t) = Vmax NO3(t) x [NO3]/(Ks + [NO3])
AVHRR (Only) Model (Left-Half) For Each Pixel Satellite SST Provides NO3 Satellite DSST Provides Time-Base Maximum measured specific NO3 uptake (Vmax NO3) at time=t assuming shift-up Variation in VNO3 versus irradiance & depth of euphotic zone measurements (or from ocean color) Predicted VNO3 at time=t assuming shift-up & Michaelis-Menton kinetics Integrate VNO3 over the euphotic zone and multiply by PON to yield NPP Shift-Up: Vmax NO3(t) = VNO3 (i) + A(t) x t Michaelis-Menton Kinetics: VNO3(t) = Vmax NO3(t) x [NO3]/(Ks + [NO3])
AVHRR (Only) Model (Left-Half) For Each Pixel Satellite SST Provides NO3 Satellite DSST Provides Time-Base Maximum measured specific NO3 uptake (Vmax NO3) at time=t assuming shift-up Variation in VNO3 versus irradiance & depth of euphotic zone measurements (or from ocean color) Predicted VNO3 at time=t assuming shift-up & Michaelis-Menton kinetics Integrate VNO3 over the euphotic zone and multiply by PON to yield NPP Compute f-ratio Shift-Up: Vmax NO3(t) = VNO3 (i) + A(t) x t Michaelis-Menton Kinetics: VNO3(t) = Vmax NO3(t) x [NO3]/(Ks + [NO3])
Nitrate Bulk Models NPP is estimated using a bulk quantity termed “potential new production” (PNP) as a proxy “upper limit” for NPP where PNP has been defined in a variety of ways: For each Benguela upwelling event: z= 0 Stored NO3 z= -Ze Then sum over “n” upwelling events: (Waldron & Probyn, 1992)
In the Gulf of Maine: ===> PNP = NO3 Flux x Redfield ratio z= 0 z= -Ze NO3 Flux (Townsend, 1998)
In the Gulf of Maine: ===> PNP = d/dt[Stored NO3- NO3 Flux] x Redfield ratio z= 0 Stored NO3 z= -Ze NO3 Flux (Bisagni, in press)
Model Differences Nitrate Uptake (Shift-Up) Models In addition to “standard” hydrographic measurements of temperature, NO3, and PON, such kinetics-based NPP models require “rate measurements” of A(t), KS, and KE, the half saturation constant for NO3 uptake as a function of irradiance (depth).Moreover, measured 15N incubations, if available would allow verification of modeled VNO3(t) values. Models are sensitive to slope of temperature- NO3 regression and the applied constant heating rate (may not be constant!). Nitrate Bulk Models Utilize “standard” hydrographic measurements of temperature and NO3 but require estimates of KZ and upwelling velocity to measure the proxy PNP. Models are sensitive to slope of temperature- NO3 regression, KZ and upwelling velocity.
Summary & Conclusions Models exist which are able to estimate NPP Nitrate uptake (shift-up) models are able to make pixel-by-pixel estimates of NPP, but make some strong assumptions (heating rate) and require many in-situ rate measurements. Nitrate Bulk Models are able to make pixel-by-pixel estimates of the upper limit of NPP through estimation of PNP as a proxy for NPP, but require some physical oceanographic quantities (KZ and w). Choosing a model depends largely on the questions being asked and available data.
Summary & Conclusions Models exist which are able to estimate NPP Nitrate uptake (shift-up) models are able to make pixel-by-pixel estimates of NPP, but make some strong assumptions (heating rate) and require many in-situ rate measurements. Nitrate Bulk Models are able to make pixel-by-pixel estimates of the upper limit of NPP through estimation of PNP as a proxy for NPP, but require some physical oceanographic quantities (KZ and w). Choosing a model depends largely on the questions being asked and available data. What are the available data?