Download
1 / 17
170 likes | 222 Views
Volunteer. NERR WQ stations. Nutrient pollution varies by region.

E N D
Volunteer NERR WQ stations
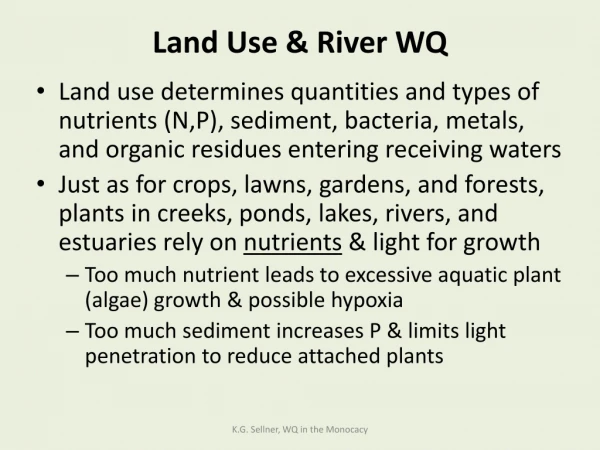
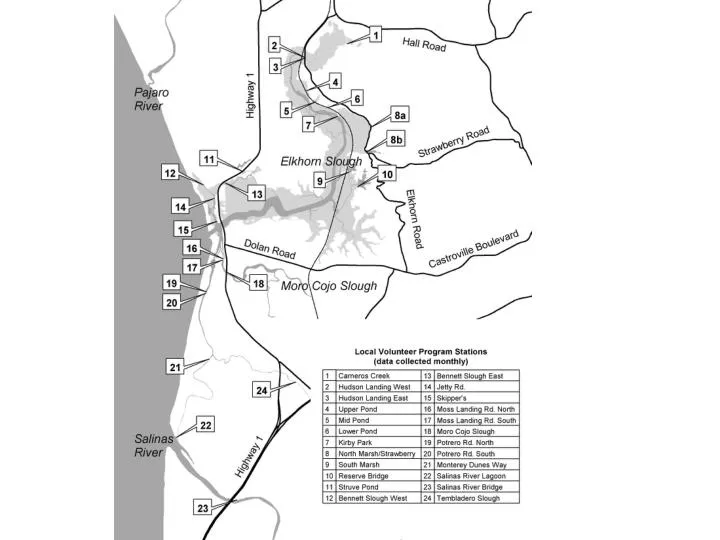
Nutrient pollution varies by region Monthly volunteer program at 24 estuarine stations shows that nitrate concentrations vary by region of the slough. Salinas river sites appear to be increasing while reserve sites appear to be decreasing in the last decade. [see http://www.elkhornslough.org/research/waterqualityvolunteer.htm]
Oxygen has remained steady Overall, dissolved oxygen in Slough waters monitored by a continuously deployed water quality sensor at two sites has not changed over the past decade, with low oxygen conditions threatening to wildlife remaining relatively rare. [see http://www.elkhornslough.org/research/waterquality nerrs.htm for more information]
How different are the NERR sites? Comparison of means of all available data by Reserve and Station, 2002 – 2006/7 OWC WEL DEL PDB HUD CBM WKB APA SFB TJR SOS CBV JAC GRB http://nerrs.noaa.gov ELK KAC NOC WQB NIW ACE NAR GND SAP GTM RKB JOB 0.001 0.01 0.1 1 10 mg NOx L-1
Percent of time DO below 28% (hypoxic) by month of the year in Azevedo Pond
Tidal range vs % time hypoxic Figure 5. Maximum tidal exchange v. % time hypoxic
How different are the NERR sites? WEL WKB CBM OWC DEL WQB ACE MAR CBV TJR ELK APA SAP NIW SFB GND GRB PDB NOC HUD RKB GTM JAC SOS JOB KAC NAR 0.1 1.0 10 100 mg Chl a L-1 Comparison of means of all available data by Reserve and Station, 2002 – 2006/7 http://nerrs.noaa.gov