Download
1 / 25
250 likes | 410 Views
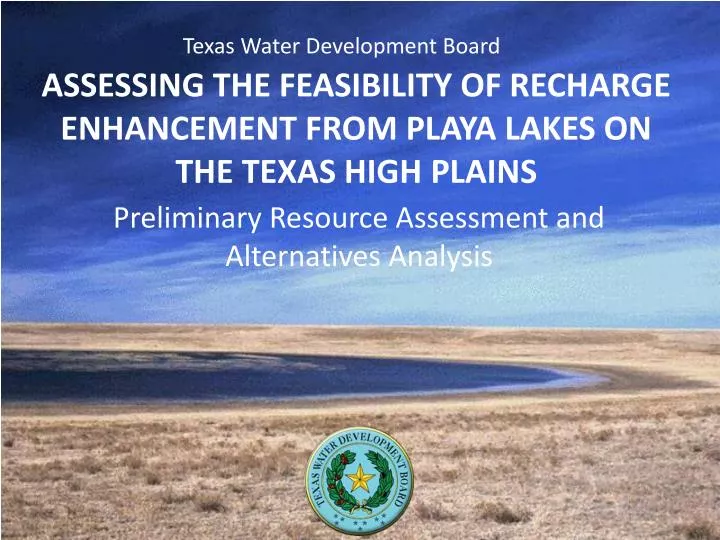
Texas Water Development Board. ASSESSING THE FEASIBILITY OF RECHARGE ENHANCEMENT FROM PLAYA LAKES ON THE TEXAS HIGH PLAINS. Preliminary Resource Assessment and Alternatives Analysis. Presentation Outline. Objective #1: quantify water resource potentially available from playa lakes

E N D
Texas Water Development Board ASSESSING THE FEASIBILITY OF RECHARGE ENHANCEMENT FROM PLAYA LAKES ON THE TEXAS HIGH PLAINS Preliminary Resource Assessment and Alternatives Analysis
Presentation Outline Objective #1: quantify water resource potentially available from playa lakes Playa geography Field monitoring network Landsat imagery Image classification Reconstructed water levels Water volumes Objective #2: evaluate playa modification alternatives Design objectives Design alternatives Preliminary costing Alternatives analysis
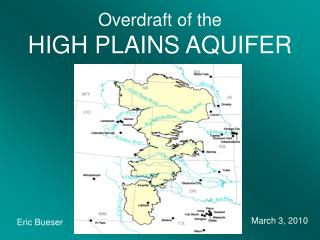
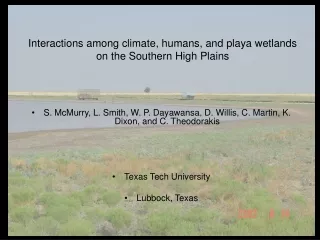
Texas Playa Geography 19,229 mapped playas Closed basins with clay bottoms Average 18.77 acres in area Most basins < 10 feet total depth Capture 80% to 90% of runoff Extent of Ogallala Aquifer Area of detail 30 miles North
Playa Monitoring Network Water balance monitoring strategy Monitoring sites in 15 counties 34 TWDB sites, established 2011 - 2013 17 playas with weather stations and soil moisture sensors 17 playas with water level sensors only 30 ARS/Texas Tech sites, established 2006 - 2010 20 playas with weather stations 10 playas with water level and precipitation only Relatively short period of record compared to climate cycles MetStation ARS-TTU site LEGEND Water level only 30 miles
Playa Monitoring Network Supplement field data with longer-term Landsat observations 47 TWDB and ARS-TTU field sites within path 30/row 36 image tile 115 miles Landsat 30 - 36 image area MetStation ARS-TTU site LEGEND Water level only
Playa Monitoring Network Supplement field data with longer-term Landsat observations 47 field sites within path 30/row 36 image tile 27 sites with detailed topographic surveys Landsat 30 - 36 image area MetStation ARS-TTU site LEGEND Water level only
Playa Monitoring Network Supplement field data with longer-term Landsat observations 47 field sites within path 30/row 36 image tile 27 sites with detailed topographic surveys 142 Landsat scenes from 1/26/02 to 12/15/2012 evaluated Landsat 30 - 36 image area MetStation ARS-TTU site LEGEND Water level only
Playa Monitoring Network Supplement field data with longer-term Landsat observations 47 field sites within path 30/row 36 image tile 27 sites with detailed topographic surveys 142 Landsat scenes from 1/26/02 to 12/15/2012 evaluated Water areas defined in each scene Landsat 30 - 36 image area MetStation ARS-TTU site LEGEND Water level only
BGRNIR mid-IR thermal IR Water Classification Landsat images use 7 bands Blue, green, red, near IR, mid IR, panchromatic, and thermal IR Band 5 identifies water best Open water uniformly dark Soil minerals bright Vegetation and moist soil have intermediate reflectance Cutoff value for water varies seasonally Landsat Bands with Water Spectrum Soil and Vegetation Spectrum
Landsat Band 5 classification • Landsat 5 and Landsat 7 Band 5 imagery utilized • Water areas identified using default ArcMap natural breaks classification • Water pixels contoured and saved as polygons • Polygon areas used with topographic data to derive water depth and volume Scan line band gap in Landsat 7 imagery Mapped playa area (blue) Water area (red)
GPS survey of playa topography Trimble R-6 Base and Rover Local area survey, not tied to regional benchmarks Base location on stable point outside playa to allow repeat surveys to assess sedimentation and soil movement
Summary of reconstructed playa water levels Average of 27 playas 39.4 acre area Flooded 20.9% of time Range from 40% to 5.8% 22.6 acre feet of floodwater per year 0.6 foot average flood depth Range from 0.11 to 2.08 feet
Summary of reconstructed playa water levels Water yield • Less water than 2003 TWDB estimate • No clear geographic trend • No clear land use trend • Playas with highest yield appear to be more integrated into drainage network • Playas with higher water yield better candidates for modification Potential playa modification sites can be screened using quick topo survey and GIS tools
Playa Modification Objectives • Increase groundwater recharge • Minimize initial cost • Utilize low maintenance designs • Incorporate native plant species • Maintain wetland ecosystems • Take water from evaporation, not wildlife • Reduce sedimentation in playa basins • Benefit landowners • Forage crops and wildlife management in short term • More groundwater in the long term
Playa Modification Alternatives • Sediment removal & buffer planting • Restores wetland and controls erosion • Increases storage and infiltration • Improves wildlife habitat • Upland percolation basin • More rapid infiltration outside clay area in playa bottom • Active system requires pumps, pipe • Combine with vegetative buffers
Playa Modification Alternatives • Ring dikes • Retains runoff and promotes infiltration • Traps sediments • Minimal maintenance • Deep plowing and/or planting deep-rooted vegetation • Breaks up low permeability layers • Roots establish channels for percolation • Flood-tolerant grasses provide forage crop
Playa Modification Alternatives • Bio-stimulation • Organic additives to replace lost soil carbon and stimulate microbial activity • Promote clay aggregation • Increase forage production • Other concepts – add your ideas! cotton gin waste manure ???????
Playa Modification Cost & Effectiveness • Cost based on implementation at 40 acre playa • Effectiveness expressed as percentage of runoff converted to recharge • Volume based on 40 acre feet per year runoff to playa
Groundwater Recharge Assessment Analysis needs to consider: Water use Value of water Recharge system costs Site specific factors San Antonio ASR pipeline construction; image from http://www.lan-inc.com/ San Antonio Water System Twin Oaks ASR facility; image from www.edwardsaquifer.net Production well; image from www.peerlessequipment.com/images
Playa Modification Summary Use GIS tools to select larger playas with highest yield Playa modifications best suited as long-term option for: Small urban centers Feedlots and dairies Household and ranch use Recharge quantities uncertain for most alternatives
Acknowledgements Cody Byars, USDA/ARS Lubbock Cole Camp, Panhandle GCD Gerald Crenwelge, High Plains UGCD #1 Dennis Gitz , USDA/ARS Lubbock Ken Rainwater, Texas Tech University Rick Zartman, Texas Tech University and The participating landowners of the Texas High Plains For additional information, please contact andrew.weinberg@twdb.texas.gov 512-463-3210