Download
1 / 18
180 likes | 283 Views
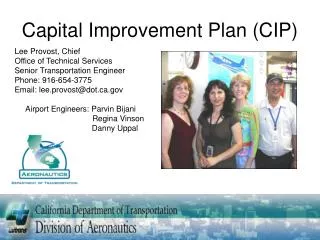
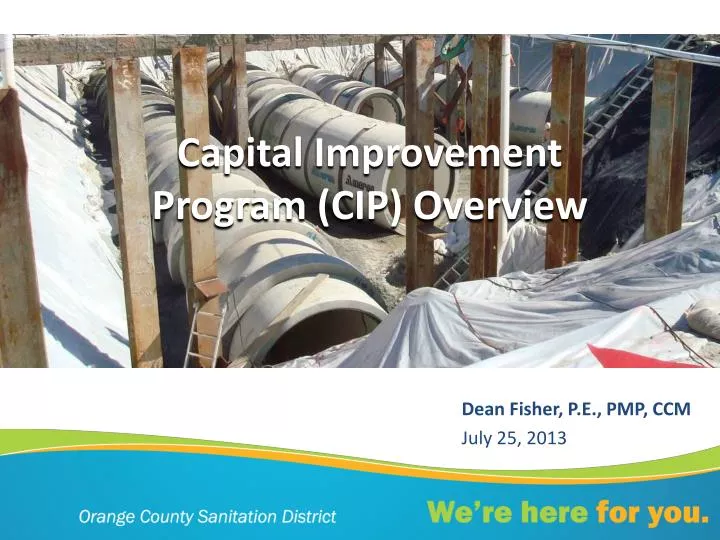
Capital Improvement Program (CIP) Overview. Dean Fisher, P.E., PMP, CCM July 25, 2013. OCSD Service Area 479 square miles 210 million gallons per day 2.5 million population 21 cities, 3 special districts 580 miles of sewers 15 pump stations 2 treatment plants. Los Angeles.

E N D
Capital ImprovementProgram (CIP) Overview Dean Fisher, P.E., PMP, CCM July 25, 2013
OCSD Service Area479 square miles210 million gallons per day 2.5 million population 21 cities, 3 special districts 580 miles of sewers 15 pump stations 2 treatment plants Los Angeles Orange County ServiceArea San Diego
Reclamation Plant No. 1Fountain Valley Treatment Plant No. 2Huntington Beach
Background • EPA Consent Decree Secondary Treatment 2002 - 2012 • Full Secondary December 2012 • Future Renewal, Replacement and Rehabilitation
Strong Financial Position • Revenues from user fees and connection fees • Proactive forecasting and planning • AAA Bond Rating
More than 70 Projects $1.8 Billion Dollars invested in our Infrastructure
100% Secondary Standards 70 mgd Reclamation Increased System Reliability Lower Engine Emissions Less Odors Disinfection Treat Urban Runoff Fire & Safety Code Compliance IncreasingLevel of Service
CIP DriversEnhanced Planning Methodology Capacity Level of Service or Regulatory Change Plant or Collection System Condition Of Assets Business Efficiency & Research Outcome
CIP DriversEnhanced Planning Methodology Capacity Plant or Collection System Level of Service or Regulatory Change Condition OfAssets Business Efficiency & Research Outcome
CIP DriversTransition to Rehabilitation Dome Support Outer Wall Primary Influent Line Mechanism Coating Failure
Current Projects in Design/Construction • Biosolids Dewatering • Digester Improvements • Ocean Outfall Rehabilitation • Plant Utility/Safety Rehabilitations • Newport Beach Collections
Upcoming Planned Projects • Headworks Rehabilitation - $50 Million • Outfall Pump Station Rehabilitation - $20 Million • Primary Clarifier Rehabilitation - $120 Million • Digesters Rehabilitation - $50 Million • Digester Gas Facilities Rehabilitation - $40 Million • Collections Rehabilitations - $100 Million • Odor Control Master Planning - $20 Million • Admin. Facilities Master Planning - $40 Million
Upcoming Design Proposals Next 2 Years (2013-2015) Also – Upcoming Planning Studies RFP in August