Download
1 / 20
200 likes | 376 Views
DARPA Sensor Information Technology (SenseIT) Program Steve Beck Joe Reynolds 512-929-2034 512-929-2541 sbeck@tracor.com joereynolds@tracor.com Analysis and Applied Research Division 6500 Tracor Lane, MS.1-8 Austin TX 78725. Presentation Outline. SenseIT Problem

E N D
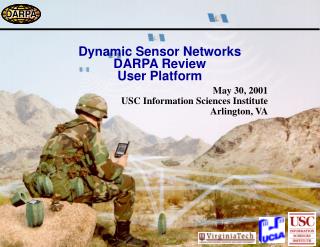
DARPA Sensor Information Technology (SenseIT) Program Steve Beck Joe Reynolds 512-929-2034 512-929-2541 sbeck@tracor.com joereynolds@tracor.com Analysis and Applied Research Division 6500 Tracor Lane, MS.1-8 Austin TX 78725
Presentation Outline • SenseIT Problem • Focus of Marconi’s Work • Detection and Ground Truth. • Experimental Data Collection • Data Analysis • WinCE Processor Status.
SenseIT Detection Problem • Target detection in an unconstrained surveillance environment. • System use/reuse during a changing tactical picture. • Provide the eyes, ears, and communication capability of human sentries. • Build a bigger picture than the traditional “I got one” detection system. - Reasoning - We have no troops in this area. We know the locs of Sentries 1 & 2. Detection Time T2 > Time T1. - Therefore – =>Enemy troop movement in Direction D and At Velocity V. - Sentry 1 - No, But I Heard Troops at Time T1 - Query - Have You Heard Any Vehicles? - Sentry 2 - No, But I Heard Troops at Time T2
Military Critical Technologies: Passive Sensor Detection • Military Use of Passive Sensors • Intruder detection. • Target vehicle detection and localization. • Direct fire weapons detection and localization. • Performance Objectives for Military Passive Sensors • 98% correct detection of target from background. • Localize weapons within 10 meters out of 5000 meters range. • Operate in conditions close to weapons fire and explosions. • Requirements for Superior Passive Sensor Detection • Signal Processing. • Weighting and selection of clues. • Validated decision criteria. • Performance in cluttered background.
Marconi’s Main Objective • Provide target detection software that runs on a distributed network of nodes. • Provide superior Pdet with low Pfa in an operational scenario. • Demonstrate the effectiveness of collaborative signal processing. Marconi’s Top Level Approach • Collect data that is representative of the scenario, the targets, and the environment. • Optimize the processing algorithms for targets of interest. • Implement agents for multiple task requests and dynamic reconfiguration. • Optimize the detection performance using networked collaboration. • Optimize the software for the hardware platform.
Network Signal Processing • Detection Performance Improves with • Increased Node Collaboration and • Increased Information Content Reasoning Reasoning on the spatial and temporal grid. Build up a tactical picture. Respond with appropriate decisions based on the global picture. Detection Improved Detection Multi-Sensor Info Fusion. Multi-Node Info Fusion Signal Processing Beamforming Source Localization Background Cancellation Information Content
Detection and Ground Truth • Robust detection requires generalized models for all events (targets and non-targets). • The models must reflect the realistic recording environment, including • sensor characteristics, background noise, and digitizer characteristics. • Detection models are constructed from actual data. • The data must have accurate ground truth. Data Collection for Detection Experiments • Use multiple channels with time synchronization. • Make recordings with high bandwidth and high fidelity. • Video tape the experiment for ground truth and demonstration.
Data Collection Experiments • Marconi performed three data collection experiments for detection studies: • Human occupancy detection in a high noise urban environment. • Tracked and wheeled vehicle detection in a rural environment. • Explosion (balloon pop) detection and localization in indoors and outdoors. Preliminary Data Collection Equipment Audio Recording - HP3964 4-channel analog instrumentation recorder using direct mode, speed=3.75 ips, bw=16 KHz. Ithaco amplifiers (4) with individual gain setting. Audio Digitizer - PC-based II PC32 4-channel simultaneous, 16 KHz/channel, 16-bits. Video Recording - Sony 8-mm Camcorder Video Digitizer - Mac AV with Fusion Recorder
Omni Mic 4 (Indoors) (Hallway) Door 4-Channel Analog Recorder with Variable Gain (Outdoors) Camcorder (Walkway) Highway Sounds Omni Mic 3 2 1 Balloons Dipole Mics Preliminary Data Collection - Experiment 1 Test Description Scenario: Urban, indoors and outdoors. Targets: Balloon pops. Doors opening and closing. People walking by. Clutter: Highway noise. Sensor Description Sensor 1 Dipole mic, outdoors, towards walkway. Sensor 2 Dipole mic, outdoors, toward highway. Sensor 3 Omni mic, outdoors. Sensor 4 Omni mic, indoors. Recorders Audio Data 4-Channel analog recorder for Sensors 1-4 providing simultaneous channel recording. Video Sony camcorder
Omni Mic 4 (Indoors) (Hallway) Door 4-Channel Analog Recorder with Variable Gain (Outdoors) Camcorder (Walkway) Highway Sounds Omni Mic 3 2 1 Balloons Dipole Mics Video #1 with Mics 1&4 Sound Experiment 1 - Audio Visual Video #2 with Mics 1&4 Sound
Experimental Data Collection 1 – Male Voice Detection Analysis Energy Detection, Bandwidth=8000 Hz. Energy Detection, Bandwidth=500 Hz. Simple Energy Detection No discrimination processing Each det based on 1 sec frames No sequential det or fusion. Chan 1, EER=31% Chan 2, EER=45% Chan 3, EER=39% Chan 4, EER=20% Chan 1, EER=52% Chan 2, EER=55% Chan 3, EER=58% Chan 4, EER=23%
Experimental Data Collection 1 - Male, Energy Plots The BLUE line is the average energy level for defined for each second. The RED line is the EER threshold. The YELLOW area is the time during Target Present for that sensor. The RED area is False Alarm times. The GREEN area is Missed Detection times. * Red and Green shaded areas that appear on the wrong side of the line are boundary plotting problems, not mistakes.
Omni Mic 4 APC & HUMV Balloons Omni & Dipole Mics Dirt Track 2 3 1 Balloons 4-Channel Analog Recorder with Variable Gain Camcorder Generator Preliminary Data Collection - Experiment 2 Test Description Scenario: Rural, outdoors. Targets: Balloon pops. APC start-up, idle, drive-by. HUMV start-up, idle, drive-by. Clutter: Generator, highway noise. Sensor Description Sensor 1 Dipole mic, outdoors, pointed south. Sensor 2 Dipole mic, outdoors, pointed north. Sensor 3 Omni mic, co-located with dipole mics. Sensor 4 Omni mic, 20 meters north of dipole mics. Recorders Audio Data 4-Channel analog recorder for Sensors 1-4 providing simultaneous channel recording. Video Sony camcorder
Omni Mic 4 APC & HUMV Balloons Omni & Dipole Mics Dirt Track 2 3 1 Balloons 4-Channel Analog Recorder with Variable Gain Camcorder Generator Video with Camcorder Sound Experiment 2 - Audio Visual Video with Mics 1&4 Sound
Experimental Data Collection 2 – Vehicle Detection Analysis Chan 1, EER=2.9% Chan 2, EER=7.0% Chan 3, EER=6.7% Chan 4, EER=6.4% Chan 1, EER=8.6% Chan 2, EER=7.0% Chan 3, EER=6.2% Chan 4, EER=6.5% Simple Energy Detection No discrimination processing Each det based on 1 sec frames No sequential det or fusion.
Detection Signal Processing - Set 1 Timer Time Series FFT Adaptive Normalizer Energy Detect Decision Event No Event Threshold Detection Signal Processing - Set 2 Timer Time Series Multi-res Normalization Signal Specific Processing Detector- Classifier Decision Event No Event Threshold
Proposed Detection Signal Processing Preprocessor Processor Time Series PreProcessor with Adapt Normalizer Real-Valued Feature Set Prob Detector/ Classifier LRT/ Fusion & Reasoning Event/ No Event Decision Discrete-Val Feature Set Prob Detector/ Classifier Alternate Process Update Models Threshold Alternate Process Update Models DataBase SP Agent IP Agent Scenario/Tactical Information
True Hypothesis Decision Description H0 D0 Correct Decision H0 D1 Type I Error (False Alarm) H1 D1 Correct Decision H1 D0 Type II Error (Miss) Bayesian Decision Criteria Binary Hypothesis Testing Modified Threshold C00 is the cost of making a correct null hypothesis decision. C11 is the cost of making a correct target present decision. C10 is the cost of making a Type I error (FA). C01 is the cost of making a Type II error (miss). New Likelihood Ratio Decision Rule
Summary and Status • Initial Data Collection • Preliminary Algorithm Development • WinCE Platform Running • Preliminary Design of Software Infrastructure