Download

1 / 8
80 likes | 196 Views
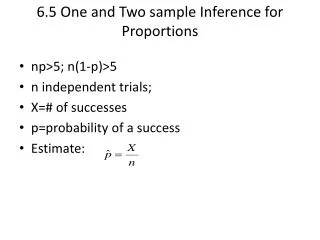
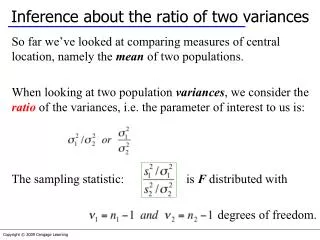
6.4 One and Two-Sample Inference for Variances. Example - Problem 26 – Page 435. D. Kim did some crude tensile strength testing on pieces of some nominally 0.012 in. diameter wire of various lengths.

E N D
Example - Problem 26 – Page 435 • D. Kim did some crude tensile strength testing on pieces of some nominally 0.012 in. diameter wire of various lengths. • Perform a hypothesis test to determine if there is a significant difference between the mean tensile strengths between 25 cm and 30 cm lengths of nominal 0.012 in. diameter wire using a significance level of 0.05. • To determine if the equal variance approach can be applied, the following hypothesis test should be performed.
Test for Equal Variances • Hypotheses
Minitab Output • Test for Equal Variances • F-Test (normal distribution) • Test Statistic: 0.487 • P-Value : 0.364 • Levene's Test (any continuous distribution) • Test Statistic: 2.710 • P-Value : 0.122
Additional Output • Descriptive Statistics: Strength by Length • Variable Length N Mean StDev • Strength 25 cm 8 4.4313 0.2314 • 30 cm 8 4.288 0.331
Two-Sample T-Test and CI: 25cm, 30cm Two-sample T for 25cm vs 30cm N Mean StDev SE Mean 25cm 8 4.431 0.231 0.082 30cm 8 4.288 0.331 0.12 Difference = mu 25cm - mu 30cm T-Test of difference = 0 (vs not =): T-Value = 1.01 P-Value = 0.334 DF = 12 Two-Sample T-Test and CI: 25cm, 30cm Two-sample T for 25cm vs 30cm N Mean StDev SE Mean 25cm 8 4.431 0.231 0.082 30cm 8 4.288 0.331 0.12 Difference = mu 25cm - mu 30cm T-Test of difference = 0 (vs not =): T-Value = 1.01 P-Value = 0.331 DF = 14 Both use Pooled StDev = 0.286