Download
1 / 26
260 likes | 386 Views
Two-Sample Inference Procedures with Means. Of the following situations, decide which should be analyzed using one-sample matched pair procedure and which should be analyzed using two-sample procedures?.

E N D
Of the following situations, decide which should be analyzed using one-sample matched pair procedure and which should be analyzed using two-sample procedures? A pharmaceutical company wants to test its new weight-loss drug. Before giving the drug to a random sample, company researchers take a weight measurement on each person. After a month of using the drug, each person’s weight is measured again. Matched pair
Of the following situations, decide which should be analyzed using one-sample matched pair procedure and which should be analyzed using two-sample procedures? A researcher wants to know if a population of brown rats on one city has a greater mean length than a population in another city. She randomly selects rats from each city and measures the lengths of their tails. Two independent samples
Of the following situations, decide which should be analyzed using one-sample matched pair procedure and which should be analyzed using two-sample procedures? A researcher wants to know if a new vitamin supplement will make the tails of brown rats grow longer. She takes 50 rats and divides them into 25 pairs matched by gender and age. Within each pair, she randomly selects one rat to receive the new vitamin. After six months, she measures the length of the rat’s tail. Matched pair
Of the following situations, decide which should be analyzed using one-sample matched pair procedure and which should be analyzed using two-sample procedures? A college wants to see if there’s a difference in time it took last year’s class to find a job after graduation and the time it took the class from five years ago to find work after graduation. Researchers take a random sample from both classes and measure the number of days between graduation and first day of employment Two independent samples
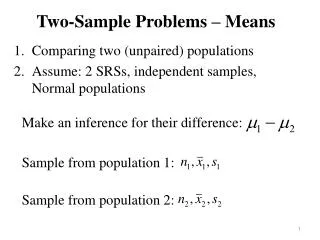
Differences of Means (Using Independent Samples) CONDITIONS: 1) The two samples are chosen independently of each other. OR The treatments are randomly assigned to individuals or objects or (vice versa) 2) The sample distributions for both samples should be approximately normal - the populations are known to be normal, or - the sample sizes are large (n 30), or - graph data to show approximately normal 3) 10% rule – Both samples should be less than 10% of their respective populations
Differences of Means (Using Independent Samples) Confidence intervals: Called standard error
Degrees of Freedom Option 1: use the smaller of the two values n1 – 1 and n2 – 1 This will produce conservative results – higher p-values & lower confidence. Option 2: approximation used by technology Calculator does this automatically!
H0: m1 - m2 = hypothesized value Ha: m1 - m2 < hypothesized value Ha: m1 - m2 > hypothesized value Ha: m1 - m2 ≠ hypothesized value Differences of Means (Using Independent Samples) Hypothesis Statements: H0: m1 = m2 Ha: m1< m2 Ha: m1> m2 Ha: m1 ≠ m2
Differences of Means (Using Independent Samples) Hypothesis Test: State the degrees of freedom
Differences of Paired Means (Matched Pairs) CONDITIONS: 1) The samples are paired. The sample differences can be viewed as a random sample from a population of differences. 2) The sample distribution of differences is approximately normal - the populations of differences is known to be normal, or - the number of sample difference is large (n 30), or - graph data to show approximately normal 3) 10% rule – The sample of differences is not more than 10% of the population of differences.
H0: md = hypothesized value Ha: md < hypothesized value Ha: md> hypothesized value Ha: md ≠ hypothesized value Differences of Paired Means (Matched Pairs) Parameter: Hypothesis Statements: md = true mean difference in …
Differences of Paired Means (Matched Pairs) Hypothesis Test:
Example 1 Two competing headache remedies claim to give fast-acting relief. An experiment was performed to compare the mean lengths of time required for bodily absorption of brand A and brand B. Assume the absorption time is normally distributed. Twelve people were randomly selected and given an oral dosage of brand A. Another 12 were randomly selected and given an equal dosage of brand B. The length of time in minutes for the drugs to reach a specified level in the blood was recorded. The results follow:mean SD n Brand A 20.1 8.7 12 Brand B 18.9 7.5 12 Is there sufficient evidence that these drugs differ in the speed at which they enter the blood stream?
Parameters and Hypotheses μA = the true mean absorption time in minutes for brand A μB = the true mean absorption time in minutes for brand B μA - μB= the true difference in means in absorption times in minutes for brands A and B H0: μA - μB = 0 Ha: μA - μB 0 Assumptions (Conditions) 1) The samples must be random and independent which is stated in the problem. 2) The sample distributions should be approximately normal. Since it is stated in the problem that the population is normal then the sample distributions are aprroximately normal. 3) The samples should be less than 10% of their populations. The population should be at least 240 people, which I will assume. 4) A and Bare both unknown Since the conditions are met, a t-test for the two-sample means is appropriate.
Calculations = 0.05
Decision: Since p-value > a, I fail to reject the null hypothesis at the .05 level. Conclusion: There is not sufficient evidence to suggest that there is a difference in the true mean absorption time in minutes for Brand A and Brand B.
Page 567: #5 State the parameters μA = the true mean time it takes to commute taking Route A μB = the true mean time it takes to commute taking Route B μB - μA = the true difference in means in time it takes to commute taking Route B from Route A Justify the confidence interval needed (state assumptions) 1) The samples must be random and independent which is state in the problem. 2) The sample distributions should be approximately normal. It is stated in the problem that graphs of the travel times are roughly symmetric and show no outliers, so we will assume the distributions are approximately normal. 3) The samples should be less than 10% of the population. The population should be at least 400 days, which I will assume. 4) A and Bare both unknown Since the conditions are satisfied a t – interval for the difference of means is appropriate.
Calculate the confidence interval. 95% CI Explain the interval in the context of the problem. We are 95% confident that the true mean difference between the commute times is between 1.3599 and 4.6401 minutes.
Page 590: 18 Parameters and Hypotheses μd = the true mean difference in scores between June and August for students who repeated the course in summer school Ho: μd = 0 Ha: μd> 0
Assumptions (Conditions) 1) The samples must be paired and random. The samples are from the same student so they are paired and we will assume the sample differences are a random sample of the population of differences.. 2) The sample distribution should be approximately normal. The normal probability plot is fairly linear and the boxplot shows no outliers, so we will assume that the sample distribution of differences is approximately normal. 3) The sample should be less than 10% of the population. The population should be at least 60 students, which we will assume. 4) is unknown Since the conditions are met, a t-test for the matched pairs is appropriate.
Calculations 5.333 7.4475 5.333 7.4475 = 0.05
Decision: Since p-value > a, I fail to reject the null hypothesis at the .05 level. Conclusion: There is not sufficient evidence to suggest that the true mean difference in scores is different from June to August. This suggests that program may not be worthwhile.