Download
1 / 15
150 likes | 411 Views
Statistics 111 - Lecture 15. Two-Sample Inference for Proportions. Administrative Notes. HW 5 due on July 1 (next Wednesday) Exam is from 10:40-12:10 on July 2 (next Thursday) Will focus on material covered after midterm

E N D
Statistics 111 - Lecture 15 Two-Sample Inference for Proportions Stat 111 - Lecture 15
Administrative Notes • HW 5 due on July 1 (next Wednesday) • Exam is from 10:40-12:10 on July 2 (next Thursday) • Will focus on material covered after midterm • You should expect a question or two on topics covered before the midterm Stat 111 - Lecture 15
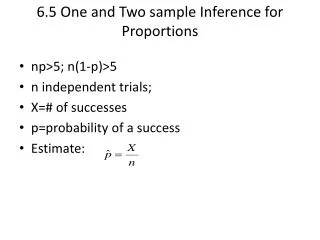
Count Data and Proportions • Last class, we re-introduced count data: Xi = 1 with probability p and 0 with probability (1-p) • Example: Pennsylvania Primary • Xi = 1 if you favor Obama, Xi = 0 if not • What is the proportion p of Obama supporters at Penn? • We derived confidence intervals and hypothesis tests for a single population proportion p Stat 111 - Lecture 15
Two-Sample Inference for Proportions • Today, we will look at comparing the proportions between two samples from distinct populations • Two tools for inference: • Hypothesis test for significant difference between p1 and p2 • Confidence interval for difference p1 - p2 Population 1:p1 Population 2:p2 Sample 1: Sample 2: Stat 111 - Lecture 15
Example: Vitamin C study • Study done by Linus Pauling in 1971 • Does vitamin C reduce incidence of common cold? • 279 people randomly given vitamin C or placebo • Is there a significant difference in the proportion of colds between the vitamin C and placebo groups? Stat 111 - Lecture 15
Hypothesis Test for Two Proportions • For two different samples, we want to test whether or not the two proportions are different: H0 : p1 = p2 versus Ha : p1p2 • The test statistic for testing the difference between two proportions is: • is called the pooled standard error and has the following formula: • is called the pooled sample proportion Stat 111 - Lecture 15
Example: Vitamin C study • We need the following three sample proportions: = 17/139 = .12 = 31/140 = .22 = 48/279 = .17 • Next, we calculate the pooled standard error: = • = = √(.17*.83*(1/139 + 1/140)) = .045 • Finally, we calculate our test statistic: z = (.12-.22)/.045 = -2.22 Stat 111 - Lecture 15
Hypothesis Test for Two Proportions • We use the standard normal distribution to calculate a p-value for our test statistic • Since we used a two-sided alternative, our p-value is 2 x P(Z < -2.22) = 2 x 0.0132 = 0.0264 • At a = 0.05 level, we reject the null hypothesis • Conclusion: the proportion of colds is significantly different between the Vitamin C and placebo groups prob = 0.0132 Z = -2.22 Stat 111 - Lecture 15
Confidence Interval for Difference • We use the two sample proportions to construct a confidence interval for the difference in population proportions p1- p2 between two groups: • Interval is centered at the difference of the two sample proportions • As usual, the multiple Z* you use depends on the confidence level that is needed • eg. for a 95% confidence interval, Z* = 1.96 Stat 111 - Lecture 15
Example: Vitamin C study • Want a C.I. for difference in proportion of colds p1 - p2 between Vitamin C and placebo • Need sample proportions from before: = 17/139 = .12 = 31/140 = .22 • Now, we construct a 95% confidence interval: (.12-.22) +/- √(.12*.88/139 + .22*.78/140) =(-.19,-.01) • Vitamin C causes decrease in cold proportions between 1% and 19% Stat 111 - Lecture 15
Another Example • Has Shaq gotten worse at free throws over his career? • Free throws are uncontested shots given to a player when they are fouled…Shaquille O’Neal is notoriously bad at them • Two Samples: the first three years of Shaq’s career vs. a later three years of his career Stat 111 - Lecture 15
Another Example: Shaq’s Free Throws • We calculate the sample and pooled proportions = 1353/2425=.558 =1121/2132=.526 =2474/4557=.543 • Next, we calculate the pooled standard error: = √(.543*.467(1/2425+1/2132))=.015 • Finally, we calculate our test statistic: Z = (.558-.526)/.015 = 2.13 Stat 111 - Lecture 15
Another Example: Shaq’s Free Throws • We use the standard normal distribution to calculate a p-value for our test statistic • Since we used a two-sided alternative, our p-value is 2 x P(Z > 2.13) = 0.0332 • At = 0.05 level, we reject null hypothesis • Conclusion: Shaq’s free throw success is significantly different now than early in his career prob = 0.0166 Z = 2.13 Stat 111 - Lecture 15
Confidence Interval: Shaq’s FT • We want a confidence interval for the difference in Shaq’s free throw proportion: = 1353/2425=.558 =1121/2132=.526 • Now, we construct a 95% confidence interval: (.558-.526) +/- 1.96 *√(.558*.442/2425 +.526*.474/2132) (.003,.061) • Shaq’s free throw percentage has decreased from anywhere between 0.3% to 6.1% Stat 111 - Lecture 15
Is Shaq still bad at Free Throws? Stat 111 - Lecture 15