Download

1 / 42
420 likes | 421 Views
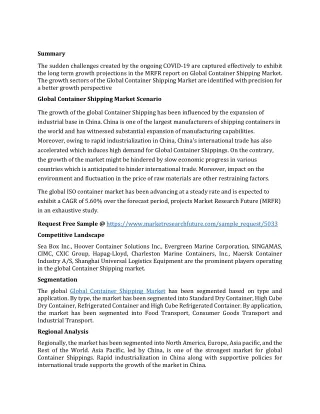
This paper examines five factors impacting the global future of shipping including demand and supply prospects, market equilibrium, freight rates, profitability issues, and potential threats. The analysis focuses on the effects of the 2008 economic crisis and explores various global shipping demand prospects.

E N D
The Global Future of Shipping Jack Dyer September 2013 ESSA 2013 Conference University of Free State
INTRODUCTION • THIS PAPER CONCENTRATES ON FIVE FACTORS ASSESSING THE GLOBAL FUTURE OF SHIPPING FOR 2013 AND BEYOND GIVEN THE 2008 ECONOMIC CRISIS • I: The recent behaviour and the prospects for seaborne transport capacity demand across dry bulk and container markets –general and specific sector • II: Supply prospects across both the dry bulk and container markets– evaluating the demolition; construction and second hand markets • III: The unfolding demand and supply balance –the implications of market equilibrium • IV: Recent freight rate behaviour and market prospects to assess 2013 and beyond potential • V: Potential issues affecting overall profitability and the chance of a sustainable recovery: including investor expectations; potential shipping financing issues; the impact of technical regulatory requirements; bunkerage and insurance costs; plus the threat of global piracy
GLOBAL SHIPPING DEMAND PROSPECTS • THE 2008 RECESSION • THE ARAB SPRING • SA/ OTHER AFRICAN/ GLOBAL PORT EXPANSION PROSPECTS, INTRODUCTION OF FREE TRADE ZONES e.g. Mombasa AND CABOTAGE • OUTSOURCING FROM CHINA TO LOWER WAGES IN INDIA, VIETNAM, BANGLADESH • EXPANSION OF BRAZILIAN SHIPYARDS • BRICS AND ASIAN DEMAND PROSPECTS • OPENING OF PANAMA CANAL FROM 2014 ONWARDS • ECONOMIES OF SCALE
GLOBAL SHIPPING DEMAND PROSPECTS • World shipping demand will be lower initially; from decreasing trade growth but further sustained by industries outsourcing from China to lower wages in Vietnam, India and Bangladesh (Stopford 2009), when converting to manufacturing intermediate/ higher value goods; and Brazil’s construction of 7 new shipyards (while expanding existing ones); from parastatal Petrobras investing $225 billion in five years (including ship financing); employing 56000 people; • This will be sustained by iron ore exports to China; will improve global shipping’s future Suezmax sector demand; (BRS 2013). The 2012 replacement demand (upgrading old vessels to modern); reached 60 million deadweight tonnes –Stopford 2012); from commercial expectations –i.e. Greeks paid $25000000 for three 84000 TEU. • Hamburg Sud invested 8000 -9200 TEU in South America; Greek firms Costamare ordered 8 vessels);Tsakas Shipping (92) and Oriental Energy ordered 6 VLCC (Fairplay Solutions 2012/ 2013); will preserve modest seaborne transport demand growth, and is projected to stabilise the chance of a sustainable economic recovery
GLOBAL SHIPPING DEMAND PROSPECTS • This assignment forecastsuncertain prospects for dry bulk sea transport demand levels reduced from excess stockpiling and continuing commodity prices; (i.e. lower Indian rice Malaysian palm oil exports/). • However; Greek and Japanese dry bulk demand has risen (Fairplay 31 January 2013); especially over rising issues of food security and an unsustainable surge in dry cargo imports (www.isl.org 2013); reducing trade. • Certain commodity prices may increase seasonal bulk sea transport demand i.e. grain prices improving for St Lawrence Seaway opening and Columbian iron ore exports rising through Panama’s canal expansion, (Fairplay, 24 January 2013); (Daily Collection 16 April 2013)/ US recovery from drought. • Higher steel prices and lower Chinese stockpiling/ crop production raised demand for Australian/ South African iron ore and agriculture; affecting daily Capesize earnings to rise 2.6% in a month (one of post 2008 highest) to $4701.
GLOBAL SHIPPING DEMAND PROSPECTS • Mineral extraction has increased Russian domestic shipping bulk demand; - especially waterways and the White/ Baltic Sea (Fairplay 31 January 2013). • Panamax increased 1.6% to $8892 from favoured factors such as good South American grain and soybean harvests (Fairplay 29 November 2012) plus a rise in shipping demand from Mauritanian hydrocarbon expansion in (with limited transport substitutes to shipping using Nouadnibo from Nouakchott) as investment rose from $128 million 2010 to $176 million 2011; may improve the bulk industry from 2013 onwards.... • Initially; the global future of shipping will be constrained by further uncertainty over maritime transport demand behaviour (Gordon 2009) as shippers/ charterer’s adjust to states in recession reacting with trade protectionist measures (UNCTAD 2012); decreasing profitability and investment (Stopford 2012), with demand growth contracting from reduced China/ Japan trade surpluses, lower employment and productivity for both dry bulk and containership industries; a 3 % rise in Suez canal duties (Fairplay 2013); destocking rises and increased bunkerage costs; (UNCTAD TDR 2012).
WORLD AND SEABORNE TRADE GROWTH • Project modest seaborne trade growth of 3.8% forecast 2013 and 5.5% for 2014, compared to 12.7% (2010) and 5.9% (2011) and 4 % (2012), • World GDP growth indicated positive growth in 2012 (3.2%); projected to increase to 3.5% in 2013 and 4.1% in 2014 • Seaborne trade growth projected to increase 5 -10% over the next few years
WORLD AND SEABORNE TRADE GROWTH • However; liner industry demand potential will improve; illustrated by higher container trade flows growth rate from -9% in 2009 to 6% in 2013 UNCTAD 2012) -as higher globalisation leads to higher containerisation and container trade volumes between regions and developing world trade routes. • Recycled paper; scrap steel and less conventional dry bulk commodities will convert to containerisation from greater scale economies (UNCTAD 2012). The market outlook for both the dry bulk and the liner shipping industries will stabilise; facilitating future viability, given the historically unprecedentedvolume of goods loaded worldwide to 8.7 billion tons (UNCTAD, 2012); • This projectsasmall percentage growth in seaborne trade volume and demand over the next decade; through factors such as opening extended Panama locks (5% traffic growth 2012) and Arab Spring stability from 2014 onwards, creating maritime transport scale economies (BRS 2013); increasing vessel size and profitability; expanding competition; while reducing tonnage miles and bunkerage costs..
FUTURE SHIPPING SUPPLY PROSPECTS • WORLD FLEET OVERSUPPLY – • 5693 vessels of 242,632,935 dwt: comprising 1640 bulk; 556 general cargo; 530 containers and 998 tankers, by January 2013 • 40% world increase 2008 -2012 (8% rise 2011/ 2012); from overinvestment based on historic shipping cycle volatility and the 2008 financial crisis; • the containership fleet increased from 169,000,000 dwt to 1,980,000,000 (2010 -2012), compared to dry bulk with 457,000,000 rising to 623,000,000 dwt (2012) and a general cargo slight decline from 108,000,000 to 106,000,000 dwt. • greater fleet productivity across vessel types; as idle tonnages occupy lower shares in percentages of the world fleet for dry bulk (0.88% to 0.47% 2011) and general cargo (2.18% to 1.61% 2011) over 2008’s recession peak; indicating an eventual recovery and improved market outlook based on increasing capacity utilisation;
CONSTRUCTION MARKET AND NEW ORDER PROSPECTS • Deliveries dropped 149m dwt (159m dwt 2011) and 149m (2010). 750 orders cancelled 2010 to 260 in 2011 to 145 in 2012. • Lower orders for both Liner Vessels (Orderbook 2013 -2018) from 852 vessels 2012 to 513 expected 2013 to 14 (2016) and Dry Bulk Orderbook 2013 -2018 from 1375 vessels in 2012 to 203 in 2013 to 12 in 2016; (below 2003 -2008 average). • Many shipyards face closure experiencing enhanced production costs and reduced orders; from lost subsidies and tax concessions (e.gUSA) –or now focus on repairs and scrappage; lowering recovery prospects further; i.e. for Eastern Europe in 2012; there were only 159 orders and 2013 -2015 = 390 vessels to 2015 (mostly icebreakers and fishing vessels) and none thereafter • Supply prospects are enhanced however; through the percentage of active fleet on order by vessel type (UNCTAD 2012) which stabilised at 16% in 2012 (same as 2002 prosperity) for containerships; increased for dry bulk from 10 to 18%.
CONSTRUCTION MARKET AND NEW ORDER PROSPECTS • Additionally; oversupply will depress charter rates; since both (container and multipurpose for liner vessels and Panamax/ Supramax for dry bulk) are mainly favouring larger vessels based on greater scale economies (Stopford 2009) and lower bunkerage costs; ensuring that small vessels with lower profit margins and higher lay up costs are scrapped. • Supply prospects are enhanced however; through the percentage of active fleet on order by vessel type (UNCTAD 2012), which stabilised at 16% in 2012 (same as 2002 prosperity) for containerships; increased for dry bulk from 10 to 18%. • A potentially sustainable recovery across vessel types is indicated by the vessel orderbook in world fleet tonnage growth average of 80 million post crisis (2009 -2011) from 200 million dwt annual average 2006- 2008; (UNCTAD TDR 2012). • Eventually supply will balance with demand as both will eventually benefit from significant projected lower delivery volume/ new supply from 2013; as market expectations adjust (BRS 2013); temporarily promoting shipping market confidence e.g. -2 prime Chinese carriers COSCO and CSCL increased orders 20%. (Gordon 2011).
SHIPPING SCRAPPING INFLUENCES: • Supply prospects will improve; from renewed demand from China shipbuilders, East Asia/ Greek demand, plus India, Pakistan and Bangladesh scrapyards; as scrappage increases reaching a historic volume of 57 million dwt in 2012 (BRS 2013); as owners depleted cash reserves to pay fixed costs. • In May 2012; a 13 year old vessel was scrapped –the youngest since the 2008 Depression. • MOL was one of several, who may find it more profitable to scrap than retain by scrapping 5 vessels ;voluntarily sacrificed higher second hand prices to reduce supply with low charter rates • Demolition prices 2013 have decreased twenty percent since 2012 (BRS 2013) from increased Turkish competition at $300/ ldt; China $365/ ldt; India $375 ldt; Pakistan $380 ldt and Bangladesh $385/ ldt. • A Second hand 5 year Capesize vessel price dropped from $361893 January 2012 to $297050
SHIPPING SCRAPPING INFLUENCES: • The future market outlook for both industries predicts decreased freight rates from lower second hand price competition. (30 percent fall in values 2012/ 60 percent loss in shipowner confidence BRS 2013). Table 3.6 Second hand prices decreased across all vessel types from 2008 peaks ($45,000,000 to $34,000,000 in 2011 for 10 year old containerships (greater than 3500 TEU and $13,000,000 to $7,000,000 for vessels smaller than this. • Dry bulk second hand prices decreased from $83,000,000 in 2007 to $31,000,000 in 2011 for Panamax and $31,000,000 to $17,000, 000 for Handysize vessels; providing a further source of uncertainty for global shipping prospects as cheaper vessels discourage new shipping investment, (BRS 2013) with only159 second hand containerships sold. • No second hand sale exceeded 10000 TEU. The merchant fleet age distribution January 2012; (Table 2.3 UNCTAD 2012) became younger between 2011 -2012 for all ships (-0.58%) (-1.07% of world dwt); including dry bulk (-2.11%) (-1.97% dwt); and general cargo (-0.89%) (-1.97% dwt) indicating a lower initial future demand based on obsolescence
SHIPPING SCRAPPING INFLUENCES: • (In 2012,17% of total sales were ships less than 10 years old while 64% of sales exceeded 15 years old; containerships actually aged; increasing 0.2% (0.09% dwt). • With increased Indonesian/ Chinese speculative demand; market shipping prices (including second hand substitutes) will initially decrease to historic lows in 2013 before rising with freight rates from 2014 (second hand are only 20 -35% above low newbuilding prices);–aided by a shortage of places to beach scrapped/ second hand vessels (Fairplay 6 December 2012); eventually creating a sustainable recovery for the maritime transport industry,from those with cash reserves (aware of shipping cycle volatility).
D/ S Market Equilibrium and Equilibrium Freight Rates Global shipping’s future demand and supply will eventually stabilise from further market circumstances increasing demand: • As the Developing World recovers faster from the recession; • The impact of an estimated R225 billion Transnet infrastructure modernisation by expanding COEGA and Durban harbour from 2017/ 2018 and other improvements; • continued China growth • Russian growth from expanded demand in oil and natural gas and India for ship demolition. Shipping industry supply growth prospects will be aided by improved technical, environmental and fuel scale economies reducing slow steaming; expecting a return to equilibrium freight rates and overall maritime transport profitability; once the time lag impact of modifying vessels for fuel economy and environmental regulatory compliance adjusts; • Demand and supply will eventually stabilise to equilibrium freight rates
D/ S Market Equilibrium and Equilibrium Freight Rates • The global future for containerships from 2013 onwards; will have higher supply prospects; growing at the expense of dry bulk as on average; each carries 27 times more seaborne trade in monetary terms per dwt then a dry bulk carrier equivalent (TDR 2012) and average container vessel box carrying capacity reached 3074 TEU (20 foot) early 2012 (6% rise over 2011); while 2011 increased 34% over 2010. • The containership fleet reached 60000 TEU 2012 but could reach 1000000 TEU by 2013 (BRS 2012/ 2013); with higher global shipping demand from greater containerisation economies of scale in contrast to the dry bulk market; lowering bulker supply; as a lower global demand for natural commodities created lower charter prices. • – Investors are moving from wet to dry bulk –John Federiksen’s ordered 4 VLCC prompting others to follow from adaptive expectations (Fairplay 31 January 2013); with a 10% world dry bulk fleet rise in 2012; despite a record scrapping of 34.1 million tonnes; indicating partial sector market recovery. • Both industries indicate a future market outlook of enhanced profitability potential –(lower than 2007/ 2008 peaks) from factors such as sanctions on Iranian registered vessels and trade; reducing supply; aiding competitiveness/ freight rate sustainability for other countries (Fairplay 24 January 2013) yet, Malta’s proposed tonnage tax may reduce Mediterranean prospects.
EXPECTED FREIGHT RATE BEHAVIOUR • Containership time charter freight rates reflect diminished investor confidence; hovering at 2008 recessionary lows of $6000 per day for larger vessels (above 1700 TEU) and $5000 for smaller –those below 1700 TEU based on fulfilling contract obligations. • Bulk time charter rates (Figure 3.6 UNCTAD 2012) also predicts a further loss of economic viability -reduced potential profits with lower Indian iron ore exports –from $60000 on average May 2010 for Capesize and $28000 for Supramax shrinking to around $10000 for both in May 2012 • Post Panamax rates have improved from greater than $13000 in 2013 from greater than $10000 in 2012 (Fairplay 17 January 2013); while dry bulk rates gained 7.3 percent 6 week high for Capesize vessels to $4602 . • 1 year time charter rates 2012 -2013 improved to $12 -13000 per day. (April 2013) from increased Chinese demand for coal, iron ore and other resources; and investor expectations over Asian recovery prospects.
EXPECTED FREIGHT RATE BEHAVIOUR • However; 2013 maritime potential profitability is more likely via higher charter rates- A 5500 TEU in Anguilla traded at $18000/ day; MSC paid $15500/ day for a 6-9 month charter in the Mediterranean (Fairplay 31 January 2013). • Post Panamax rates have improved from greater than $13000 in 2013 from greater than $10000 in 2012 (Fairplay 17 January 2013); while dry bulk rates gained 7.3 percent 6 week high for Capesize vessels to $4602 . • 1 year time charter rates 2012 -2013 improved to $12 -13000 per day. (Daily Press Collection April 2013) from increased Chinese demand for coal, iron ore and other resources; and investor expectations over Asian recovery prospects. • Ultimately; both 2013 liner and dry bulk freight rates will reach equilibrium (partially from the Yuan’s depreciation aiding Japanese competitiveness and increased liner alliances consolidation/ cooperation (Fairplay Solutions 2012- 2013) before steadily increasing in market recovery; but low rates/ hire levels are expected to continue.
WHICH FACTORS WILL INDICATE THE RECOVERY OF SHIPPING?A: Shipping Expectations and Confidence Indicators • Maritime transport’s future is reflected by market and investor confidence indicators e.g. the Baltic Exchange Dry Index dropped a record 637 point low in February 2013 from a record high 20 May 2006 (11793 points); February 2013 plunged to a historic low (918 points) December 2012 from 1548 in 2011 (2758 in 2010); representing depressed recovery from the perspective of dry bulk market investors discouraged for financing further oversupply • 31 January 2013; market indicators have improved –the European Ocean Freight Forwarding Index increased 54 points in a month and the HSB Manufacturing Index reached a two year increase high of 51.9 points. • The China Shipping Confidence Index as another measure of expectations rose 14.72 to 58.76% (24 January 2013)
B: SECOND HAND SHIPPING MARKET FACTORS • 30 percent fall in second hand values 2012/ 60 percent loss in shipowner confidence. (BRS 2013) • Second hand prices decreased across all vessel types from 2008 peaks $45,000,000 to $34,000,000 in 2011 for 10 year old containerships (greater than 3500 TEU and $13,000,000 to $7,000,000 for vessels smaller than this). • Dry bulk second hand prices decreased from $83,000,000 in 2007 to $31,000,000 in 2011 for Panamax and $31,000,000 to $17,000, 000 for Handysize vessels;, with only159 second hand containerships sold. No second hand sale exceeded 10000 TEU. • On average; all vessels became younger between 2011 -2012 (-0.58%) (-1.07% of world dwt); including dry bulk (-2.11%) (-1.97% dwt); and general cargo (-0.89%) (-1.97% of world dwt) • In 2012,17% of total sales were ships less than 10 years old while 64% of sales exceeded 15 years old; The world containership fleet actually aged; increasing 0.2% (0.09% of world dwt).
C: Global Piracy; Insurance and Other Risks Affecting Future Profitability • maritime piracy incidents (more likely to target higher value containership cargo than dry bulk); diminished to 297 vessels in 2012, -150 in Africa; (439 in 2011) –while the number of hostages fell from 802 in 2011 to 585 in 2012 especially, in the Horn of Africa/ Somalia decreasing to 75 attacks 2012 (2011 experienced 237) and West Africa’s Gulf of Guinea with 58 incidents (10 hijacking); • IMO direct piracy costs between 3.4 billion and 8.7 billion US dollars per year. • decreasing risk (IMO African Piracy Code adopted April 2013) • The maritime insurance industry incurred $50 -60 billion losses in 2012 –a 13% claim rise since 2011; causing the shipping industry to face projected average additional 7% rises in insurance premium costs and 15% minimum for marine reinsurance; • regulatory expenses including 1996 Convention on Limitation of Liability for Maritime Claims/ SOLAS amendments
D: Environmental and Technical Regulatory Compliance Issues • MARPOL 1978 Protocol Annex VI ratified by Europe and main flag states of Liberia, Panama and the Bahamas; significantly reducing SOx and NOx using scrubbers from 2015 (UNCTAD 2012) is expected to further undermine the global future of shipping • MARPOL will target a minimum efficiency and emissions output reduction/ control requirement, in terms of CO2 emissions per capacity mile for new vessels (2011 onwards); using mandatory Ship Energy Efficiency Management Plans and Energy Efficient Design Indexes; integrating technical improvements; from implementing the UN Convention on Climate Change with maritime pollution –to incorporate vessels. • cofferdams around bunker tanks (now needing different fuel grades), more stringent paint and treating ballast water requirements; plus upgraded specifications for onboard equipment for engines and URL/ CSR for additional hull regulation steel requirements involving a further 2000 -3000 tons of steel. • Higher fuel prices may prompt slow steaming
E: Future Shipping Industry Financing Potential • Investment value in $ billion decreased from 264.1 to 88.9 at a low 1% globally (primarily from a 48 percent Asian investment decrease and declines in most European sectors) • Commerzbank has withdrawn; Lloyds sold 50% maritime equity to Blackburn (Fairplay 17 January 2013) and Societie General and others have eliminated exposure. Both China and Japan –as 2 major sources of shipbuilding and related finance -are only targeting their own shipping –contracting sources. • reducing capital cost from improved credit, contract of sale and preferential payment conditions; including 40% of contract price owed during construction and 60% on delivery (formerly 80% construction and 20% on delivery) plus reduced buyer guarantees and specifications. • The world maritime total syndicated loan decreased 24% 2012 to $51.92 billion–the lowest since 2009. • Germany allocated 60 million euros while Greece and China negotiated domestic shipping industry protection of $1.3 billion
F: Competition and Alliances… • The shipping industry’s future profitability will initially be undermined by growing competition. However; maritime transport operators are growing in three main alliances CKYH, MSC-CGM –CMA and G6 Alliance (GA plus NWA) and mergers -German companies Hapag Lloyd and Det Norske merged • Alliances are uniting to save shipping; postponing new building deliveries; stabilising historically low freight rates to exceed $10000 per day on average. This shipping perspective is to survive, retain market share; stimulating demand in both the dry bulk and containership markets to enhance future overall maritime transport sustainability • Eventually; they will weaken (China’s state CHIMBUSCO has reduced its 2012 60% market share 31 January 2013). from increasing competition –especially on high volume routes; globalisation and regulators; • as shipyards also cooperate (For example in China, out of 2000 shipyards in 2012; the top 10 will produce 70% of output to become more cost-effective from technical improvements –consolidating vessel range produced e.g. South Korea abandoned bulk carriers
CONCLUSION: • Sea transport demand prospects for both dry bulk and liner industries indicate a dire immediate future for global shipping • Supply prospects in 2013/ 2014 face an immense oversupply; reducing future orders…. • However; the global future of shipping will improve as the recession ends; a better second hand market; scrappage and investor expectations • This predicts the Demand/ Supply Framework will realign to market equilibrium from improved market circumstances as financial terms improve and shipyards close. • The effects upon freight market prices can be forecasted to be initially reduced from diminished financing access; from increased risks and increased competition but also will align to market equilibrium • The chances of a sustainable recovery in both the liner/ container and dry bulk shipping markets will be affected by global challenges
? ? ?Any questions Feel free to contact me on jad38@kent.ac.uk