Download
1 / 7
70 likes | 321 Views
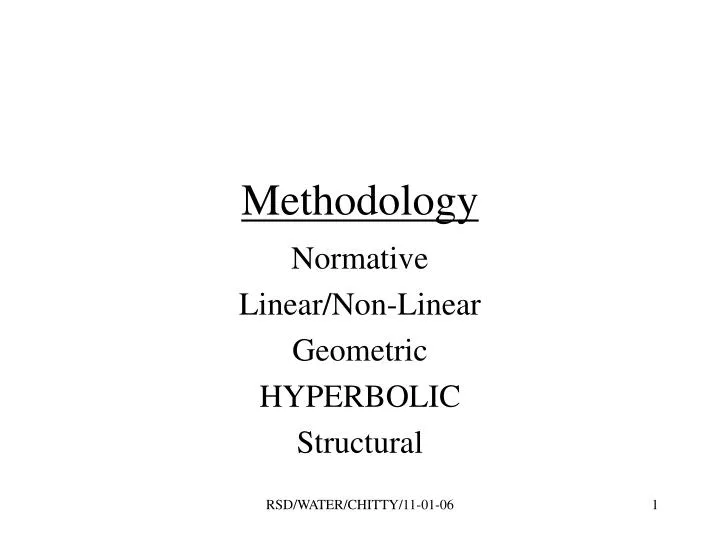
Methodology. Normative Linear/Non-Linear Geometric HYPERBOLIC Structural. · The process of discounting at a higher rate to get a payoff sooner and at a lower rate to get a pay off over long time horizon is ‘hyperbolic’ discounting.

E N D
Methodology Normative Linear/Non-Linear Geometric HYPERBOLIC Structural RSD/WATER/CHITTY/11-01-06
·The process of discounting at a higher rate to get a payoff sooner and at a lower rate to get a pay off over long time horizon is ‘hyperbolic’ discounting. • · Hyperbolic discounting was first used by psychologists (Jonathan, 2000, Chung and Herrnestein, 1967) to characterize animal behavior and later applied to humans. Others used hyperbolic discounting to intergenerational utility flows and for intra personal utility flows (Laibson, 1996). • Researchers are increasingly finding that discounting is closer to ‘hyperbolic’ than an ‘exponential’ function (Partha Dasguptha and Eric Maskin, 2004). This difference between exponential and hyperbolic discount rate is due to ‘dynamic inconsistency’ as demonstrated in the example above. RSD/WATER/CHITTY/11-01-06
. • · Hyperbolic compounding is a gradually increasing function, where the degree of compounding is inversely proportional to time ‘t’, qualified by degree of time preference ‘’, as given. • If Present valuet = Future value / [1 + t](r/) ,, • · Future value = Present valuet [1 + t](r/) Where t = time, r = interest rate and = intensity of time preference, varying between 0 and 1, with 0 representing low or no time preference and 1 representing high time preference. RSD/WATER/CHITTY/11-01-06
. • ·Obviously if there is no time preference, present value = future value and if time preference is 1, hyperbolic discounting is the same as exponential discounting. As time t is not exponential expression in ‘hyperbolic’ discounting, the degree of discounting (compounding) in ‘hyperbolic’ is lower than in ‘exponential’ method. • · Thus, the higher the value of , lower is the difference between the discounted values obtained in the near and distant future. The lower the value of , wider is the difference between discounted values obtained in the near and distant future. Due to hyperbolic discounting the present values fall less drastically compared to exponential discounting as the interest rate is weighted by alpha, the parameter, indicating degree of time preference. RSD/WATER/CHITTY/11-01-06
· Alpha value should be near to zero and discount rate should be high in the begining but alpha value should be near to one and discount rate should be low in the future periods. The crux of this method thus is in choosing the alpha value. The base line data (1997-98) used for the water use projections are from NCIWRD.. The 1997-98 base line data on water use for different uses from NCIWRD are projected for 2010, 2025 and 2050 using hyperbolic compounding. The values of alpha and discount rates used in projections are given . RSD/WATER/CHITTY/11-01-06
Water use for Agriculture Year t r 2010 13 0.012 0.02 2025 28 0.0125 0.025 2050 53 0.013 0.03 Water use for domestic purposes Year t r 2010 13 0.02 0.02 2025 28 0.03 0.025 2050 53 0.06 0.03 RSD/WATER/CHITTY/11-01-06
Water use for industrial purposes Year t r 2010 13 0.025 0.07 2025 28 0.03 0.05 2050 53 0.06 0.04 Water use for other purposes Year t r 2010 13 0.025 0.07 2025 28 0.03 0.05 2050 53 0.9 0.04 RSD/WATER/CHITTY/11-01-06