Download
1 / 14
140 likes | 256 Views
CLIMATE MODEL SIMULATES GLOBAL COLD CLIMATE DURING LATE MAUNDER MINIMUM (1675-1710). Hans von Storch, Fidel Gonz á lez-Ruoco, Ulrich Cubasch, Jürg Luterbacher, Eduardo Zorita, Beate Müller, Stephanie Legutke, and Ulrich Schlese.

E N D
CLIMATE MODEL SIMULATES GLOBAL COLD CLIMATE DURING LATE MAUNDER MINIMUM (1675-1710) Hans von Storch, Fidel González-Ruoco, Ulrich Cubasch, Jürg Luterbacher, Eduardo Zorita, Beate Müller, Stephanie Legutke, and Ulrich Schlese IUGG Sapporo, JSP 01, 1./2. Juli : The decadal to interdecadal variability of the ocean and atmosphere.
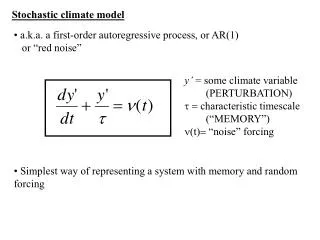
Simulation with ECHO-G (ECHAM4/HOPE-G) for • 500 years (Columbus-run), and - 1000 years (Erik run) • forced with • - variable solar output- Volcanic aerosol load- GHG concentrations
Late Maunder Minimum Cold winters and springs, 1675-1710 Analysis of Columbus run, only.
Baltic Sea ice winter index after Koslowski (1998)grey: Index, red: 5 year mean, blue:20 year mean
The Late Maunder Minimum (LMM) is the coldest phase of the so-called ‘Little Ice Age’ with marked climatic variability over wide parts of Europe. 1675-1710vs. 1550-1800 Reconstruction from historical evidence, from Luterbacher et al. Temperature conditions in Switzerland according to Pfister‘s classification. From Luterbacher, 2001
Reconstruction from historical evidence, from Luterbacher et al. Late Maunder Minimum Model-based reconstuction 1675-1710vs. 1550-1800
Ice Cores From Greenland and Antarctica North Greenland Stacked isotope record from five North-Greenland ice cores (Schwager, 2000) Reconstruction of solar variability, deduced from 10Be measurements (Crowley, 2000) Antarctica Stacked isotope record from three ice cores from Dronning Maud Land, Antarctica (Graf et al., in press )
Corals off Madagaskar The empirically reconstructed 338 year record of variations in sea-surface temperatures as inferred from the 1982-95 annual mean 18O -SST calibration equations using SST observations from different sources. (From Zinke)
·Galapagos (E-Pacific, 1oS, 90oW, Dunbar et al., 1994): 367 years of coral 18O records from 1587-1953, with annual resolution. The intervals 1660-80, 1710-1800 and 1870-95 were found warmer than “normal”, whereas the intervals 1600-1660, 1680-1700 (LMM) and 1800-25 cooler than on average. 18O increases of about 0.1-0.15‰ heavier during LMM than between 1660-70 and 1705-50 is indicative for a cooling of 0.5-0.75K. ·New Caledonia (SW-Pacific, 22oS, 166oE, Quinn et al., 1998): 335 years of coral 18O records from 1657-1952, with seasonal resolution. The records describe a brief interval of modest cooling in the late 17th century, with an annual mean SST about 0.2-0.3K cooler between 1680-1740 than between 1660-80 and 1740-50 ·Great Barrier Reef, Abraham Reef (SW-Pacific, 22oS, 153oE, Druffel and Griffin, 1993): 323 years of coral 18Orecords from 1635-1957, with bi-annual resolution. More positive 18O values (ca. 0.1‰) during the LMM, are consistent with lower SST’s of about 0.5K Zinke, pers. communication
Institut für Küstenforschung I f K Simulated differences of ice coverage, in percent, during the LMM event 1675-1710 and the long term mean 1550-1800.
LMM11671-1684NAO- and Cooling LMM2 1685-1708 NAO+ andWarming Irene Fischer-Bruns, pers. comm.
Conclusions • AOGCM ECHO-G has been integrated with natural forcing (estimates) related to solar output and volcanic aerosols and anthropogenic GHG forcing over several hundred years (Columbus: 450 yrs, Erik the Red: 1000 yrs). • Both simulations generate a globally cooler Northern winter Earth, 1400-1800, consistent with the concept of LIA. The cooling is considerably larger than described by Mann et al. The 100ß yrs Erik-simulation generates a medieval warm time during northern winter. • Both simulations simulate a marked global (north of 20°S) cooling during the Late Maunder Minimum in Northern winter. (Also: Dalton Minimum). The extra cooling amounts to 0.2-0.5K. • Model simulations consistent with a number of proxy data, in Europe, and across the globe (corals, ice cores). • Model simulates a significant ice anomaly in the Labrador Sea and adjacent seas during the LMM. NAO not uniform during LMM.