Download
1 / 22
220 likes | 270 Views
Arctic Minimum 2007 A Climate Model Perspective. Only 2 of ~20 models have any ensemble members that can keep up with 1979-2006 trend Faster than Forecast? Stroeve et al 2007. What makes these two special? Do models ever have 1 year decline as great as

E N D
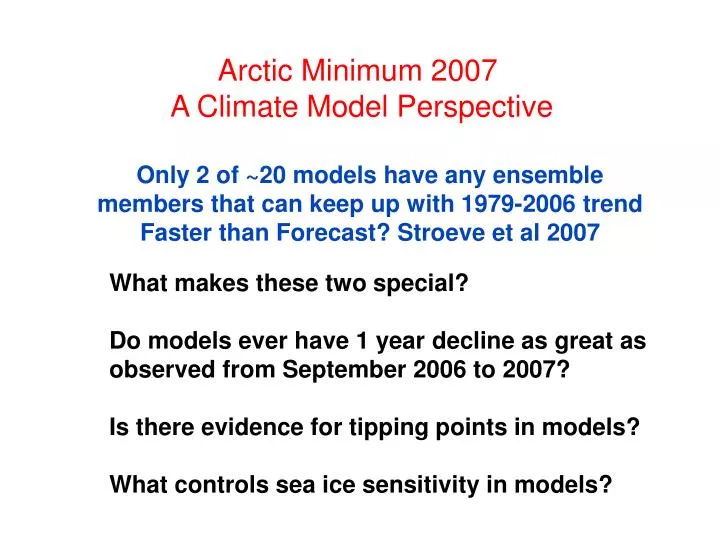
Arctic Minimum 2007 A Climate Model Perspective Only 2 of ~20 models have any ensemble members that can keep up with 1979-2006 trend Faster than Forecast? Stroeve et al 2007 What makes these two special? Do models ever have 1 year decline as great as observed from September 2006 to 2007? Is there evidence for tipping points in models? What controls sea ice sensitivity in models?
Low extent models tend to retreat faster (N) 5 models with ITD tend to retreat faster (Y), but with considerable spread
(mid-21st minus late 20th c) (Y!) April
TREND in atmospheric heat flux is negligible in the two models (N!) (Don’t know how much variability it explains) Cloud TRENDS are not unusual in the two models (N) Ice thickness in the late 20th c is high in the two models (N)
red = observations colors = 7 SRES A1B runs w/ CCSM3 black = ensemble mean Holland, Bitz, & Tremblay 2006 T85 (1.4 deg) in atmosphere and land 0.5-1 deg in ocean and sea ice
Ocean Transport Absorbed Sunlight • 1) Increase in absorbed shortwave • 2) Increase in Ocean Heat Transport through Fram Strait • Two strong positive feedbacks?
CCSM3 Single Year Decline at Least as Big as Observed in 2007
CCSM3 2001-2050 A1B Scenario - 7 Runs Histogram of 1 yr September Sea Ice Change Even with TREND skew is positive, though probably not significant 4 X in 350 years the drop is as big as observed in 2006-2007 In any decade Observed 2006-2007
red = observations colors = 7 SRES A1B runs w/ CCSM3 black = ensemble mean
Same runs only smoothed A1B Scenario
2000 Commitment 2020 Commitment 2030 Commitment A1B Scenario
Histogram of 400 yr CCSM3 1990s Control Histogram of 1 yr September Sea Ice Change No significant skew so positive and negative 1 year changes are equally likely
Histogram of 320 yr CCSM3 Pre-Industrial Contol Histogram of 1 yr September Sea Ice Change Variance is ~2/3 of modern (Because thickness is ~50% greater)
observed Autocorrelation of 400 yr CCSM3 1990s Control September ice cover
R=0.5 (0.7 skipping 2 outliers) Correlation Coefficient of linear trend 2004-2035 and mean from 1980-1999 Model uncertainty grows
R=-0.86 Trends in sea ice thickness depend on the mean state Climate Models from IPCC AR4 (CMIP3) Model uncertainty shrinks
“GAIN” G= ∆H / ∆H0 = 1.25 (on average) ∆H Sea Ice Thickness Change from doubling CO2 No Ice-Albedo Feedback - ∆H0 all Feedbacks - ∆H
Summary Two models that keep up with forecast have unusually high increase in ocean heat transport Sea ice anomalies like 2007 occur about 1% of the time in 21st century CCSM3 runs. Anomalies are not negatively skewed and there is little memory. Anomalies increase in size as ice thins. Sea Ice albedo feedback causes sea ice to thin 10-30% faster Although positive, the feedback is not large enough to cause much uncertainty in thickness prediction Instead model errors are probably more a function of error in the mean state. (Present day thickness spread in AR4 models is 1-3m)
Now with additional physical processes ∆T = ∆To + f ∆T = feedback factor = gain For a blackbody Earth-like planet When CO2 has been doubled ∆To ≈ 1.2 K
September Concentration A1B Scenario with CCSM3 September Ice Extent in one ensemble member 106 km2 Holland, Bitz, and Tremblay, 2006
Sea Level Pressure 2007 JJA Reanalysis CCSM3 JJA Composite 5 2.5 0 -2.5 -5 hPa 4 2 0 -2 -4 hPa Cloud anomalies too see Culather et al for more details