Download
1 / 21
210 likes | 398 Views
Cold Shock Response in Saccharomyces cerevisiae and the Effects of GLN3 Deletion. Kasey O’Connor Ashley Rhoades Department of Mathematics Loyola Marymount University BIOL 398/MATH 388 May 9, 2013 Seaver 202. Outline.

E N D
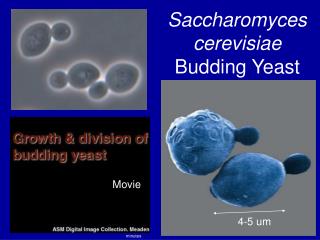
Cold Shock Response in Saccharomycescerevisiaeand the Effects of GLN3 Deletion Kasey O’Connor Ashley Rhoades Department of Mathematics Loyola Marymount University BIOL 398/MATH 388 May 9, 2013 Seaver 202
Outline • What transcription factors in Saccharomycescerevisiaecontribute to cold shock response when GLN3 has been deleted? • Exposing S. cerevisiaeto temperatures of 13°C causes the yeast cells to adapt and change gene expression • To observe the significant changes in gene expression, raw data from microarrays was centered and scaled to find significant changes in gene expression • The data was entered into STEM and YEASTRACT to be profiled and to create a regulation matrix • The MATLAB models were used to show the relative contribution of each transcription factor on gene regulation during cold shock
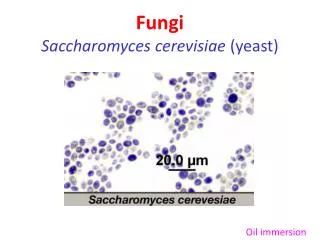
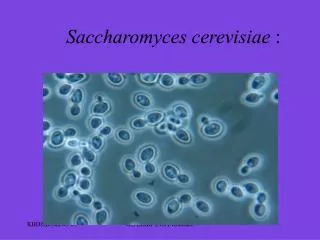
S. cerevisiaeand Decreases in Temperature • In their natural habitat, yeast cells are constantly exposed to changes in temperature daily and seasonally • Low temperatures result in a decrease in membrane fluidity and diffusion rates, alterations in molecular topology, or modifications in enzymes (Gastet al, 1993) • Optimal growth temperature is between 25°C and 35°C, and they experience cold shock from 10°C to 18°C • Yeast cells used for wine making and brewing are exposed to cold shock temperatures but remain viable and can perform fermentation (Aguilera et al, 2007) • Little is known about cold shock mechanisms and the transcription factors that regulate the adaptations in fungi
Microarray Data and Statistical Analysis • Microarray data was gathered from S. cerevisiaeexposed to temperatures of 13°C and allowed to recover back to 30°C with GLN3 deleted • GLN3 is known to encode a transcriptional activator that is involved in regulating genes that are involved in nitrogen catabolism (Courchesne & Magasanik, 1988) • RNA was collected before the cold shock, during cold shock at 15 minutes, 30 minutes, and 60 minutes, and then twice in recovery at 90 minutes and 120 minutes • The ratio of red to green flourescent for each spot was calculated and log transformed • decreases in gene expression are negative numbers • Increases in gene expression are positive numbers • The raw data was scaled and centered in Excel before computing the t-statistic and p-value to determine a significant change in expression for every gene
Using STEM to Create Gene Cluster Profiles The colored profiles show the significant clusters found from the microarray data after input into STEM
One Profile of Up Regulated Genes was Chosen for the Model • There were 286 genes associated with profile 45, and a p-value for the enrichment of genes was 6.2x10-165 • The top 5 transcription factors for this profile were: • Ste12p - 29.5% • Rap1p - 23.5% • Sko1p - 16.4% • Sok2p - 15.7% • Ino4p - 14.6%
One Profile of Down Regulated Genes was Chosen • There were 248 genes associated with profile 9, and a p-value for the enrichment of genes was 6.2x10-111 • The top 5 transcription factors for this profile were: • Ste12p: 28.6% • Rap1p: 18.8% • Ino4p: 11.7% • Sok2p: 11.7% • Aft1p: 10.4%
YEASTRACT Networks for the Transcription Factors Transcription factors from profile 45: ACE2, AFT2, CIN5, FHL1, FKH2, HAP5, HMO1, HOT1, MAL33, MBP1, MGA2, MSS11, PHD1, RAP1, SKN7, SKO1, SMP1, SOK2, STE12, SWI4, SWI6, YAP6, and ZAP1 Transcription factors from profile 45: ACE2, AFT2, CIN5, FHL1, FKH2, HAP5, HMO1, HOT1, INO4, MAL33, MBP1, MGA2, MSS11, PHD1, RAP1, SKN7, SKO1, SMP1, STE12, SWI4, SWI6, YAP6, and ZAP1
Running Two Different MATLAB Programs Yields Different Results AFT2 expression using the Michaelis-Menten model from profile 45 AFT2 expression using the Sigmoidal model from profile 45
Running Two Different MATLAB Programs Yields Different Results SOK2 expression using the Sigmoidal model from profile 45 SOK2 expression using the Michaelis-Menten model from profile 45
Running Two Different MATLAB Programs Yields Different Results PHD1 expression using the Michaelis-Menten model from profile 9 PHD1 expression using the sigmoidal model from profile 9
Running Two Different MATLAB Programs Yields Different Results RAP1 expression using the Michaelis-Menten model from profile 9 RAP1 expression using the sigmoidal model from profile 9
Comparison to the STEM Profiles For profile 45, the sigmoidal program created the most accurate depiction of the gene expression
Comparison to the STEM Profiles For profile 9, the sigmoidal program created the most accurate depiction of the gene expression
Using Heat Maps to Determine the Differences Between the Models • The top image shows the gene regulation patterns using the Sigmoidal with fix b = 0 model. • The bottom image shows the gene regulation patterns using the sigmoidal with fix b = 1 model. • There are no visible differences among what genes are up regulated and down regulated in the two models
Using Heat Maps to Determine the Differences Between the Models • The top image shows the gene regulation patterns using the Sigmoidal with fix b = 0 model. • The bottom image shows the gene regulation patterns using the Michaelis-Menten model. • There are differences among what genes are up regulated and down regulated in the two models
Conclusions • Overall, we see that the Sigmoidal resulted in transcription factor profiles that were more similar to the ones created by STEM • Both the sigmoidal with the fix b = 0 and the sigmoidal with the fix b = 1 resulted in the same heat map of up regulation and down regulation • The heat map of the sigmoidal model versus the Michaelis-Menten model produced very different heat maps
Future Research • Looking at another model, perhaps a linear one, may create profiles closer to the one generated by STEM • We can also use another program to determine which of the models previously run were more correct • We can expand our data set and include more transcription factors to see how these affect the weights of the others • Looking at the wild type data in comparison to the GLN3 deleted data could give insight into the effects of the deletion
Summary • Exposing S. cerevisiaeto temperatures of 13°C causes the yeast cells to adapt and change gene expression • After running a microarray, and statistical analysis, the data was executed in the STEM and YEASTRACT program to find gene profiles and a regulation matrix • The MATLAB models used these transcription factors related to both up regulated and down regulated genes in Saccharomycescerevisiaeexposed to cold shock • The three different profiles run resulted in the following: • The sigmoidal model with fixb = 0 had the same genes up regulated and down regulated in the sigmoidal model with fixb = 1 • The Michaelis-Menten had very different genes being up regulated and down regulated
References • Aguilera, Jaime, Francisca Randez-Gil, and Jose Antonio Prieto. "Cold Response in SaccharomycesCerevisiae: New Functions for Old Mechanisms." FEMS Microbiology Reviews 31.3 (2007): 327-41. Print. • Courchesne WE and Magasanik B (1988) Regulation of nitrogen assimilation in Saccharomycescerevisiae: roles of the URE2 and GLN3 genes. J Bacteriol 170(2):708-13 • Gast K, Damaschun G, Damaschun H, Misselwitz R & Zirwer D (1993) Cold denaturation of yeast phosphoglyceratekinase: kinetics of changes in secondary structure and compactness on unfolding and refolding. Biochemistry 32: 7747–7752.
Acknowledgments Ben G. Fitzpatrick, Ph.D. Department of Mathematics Loyola Marymount University Kam D. Dahlquist, Ph.D. Department of Biology Loyola Marymount University