Download
1 / 12
120 likes | 246 Views
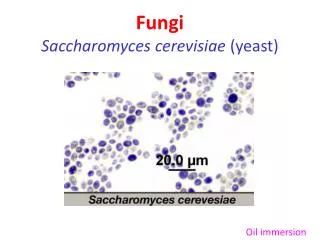
The Frequency Dependence of Osmo -Adaptation in Saccharomyces cerevisiae Jerome T. Mettetal , et al. Science 319, 482 (2008);. William J. Gibson. Background and Goals Experimental Setup Results Conclusion. Overview. Systems Biology

E N D
The Frequency Dependence of Osmo-Adaptation in Saccharomycescerevisiae • Jerome T. Mettetal, et al. • Science 319, 482 (2008); William J. Gibson
Background and Goals • Experimental Setup • Results • Conclusion Overview
Systems Biology • Attempt to gain insight into biology by viewing biological responses as a system • Holistic vs. Reductionist approach • Biological processes take place over a variety of timescales <1 second to >10^3 seconds • Pathways can involve hundreds of reactions • This level of complexity is difficult to model explicitly Background and Goals
Solution: • Use oscillating input to gain insight into system dynamics / biological mechanism. • Compare WT and mutant cells to identify which proteins drive response at different time scales. Background and Goals
Use well-characterized Hog1 osmosensory pathway to test input oscillation approach to studying pathways. Background and Goals (Hohmann, Micro Mol Bio Rev 2002)
Experimental Setup (Mettetal et al. , Science 2008)
YFP nuclear localization→HOG1 nuclear localization • HOG1 fused to YFP • NRD-RFP identifies nucleus Experimental Setup (Mettetal et al. , Science 2008)
Fourier analysis was used to approximate the input as a sine wave and the output as a sine wave at the corresponding frequency. • A second-order linear time–invariant (LTI) model was used to fit the data in B and the parameters were used to predict the response to a step input of 0.2 M NaCl (D) Results Fourier Analysis (Mettetal et al. , Science 2008)
x = the intracellular osmolyte concentration • y = enrichment of phosphorylatedHog1 above its baseline level • Hog1 dependent contribution and independent contribution (Fps1) Results System Model (Mettetal et al. , Science 2008)
16 Min .1M NaCl • With short pulses of NaCl, cyclohexamide makes no difference. • As duration of pulse increases cells normally respond more quickly • Cyclohexamide treated cells fail to adapt • Implies that gene expression drives an adaptive response 32 Min .2M NaCl Results - Osmoadaptation 45 Min .35M NaCl 60 Min .5M NaCl (Mettetal et al. , Science 2008)
Oscillating inputs accurately identifies known cell network dynamics • Engineering principles can be applied to biological systems to gain new insight into system dynamics. Conclusion
Mettetal, et al., "The Frequency Dependence of Osmo-Adaptation in Saccharomycescerevisiae" Science 2008. • Stefan Hohmann, “Osmotic Stress Signaling and Osmoadaptation in Yeasts” Microbiology and Molecular Biology Reviews, June 2002, p. 300–372 References