Download
1 / 1
10 likes | 149 Views
Table 1: Differences in relative quantities and estimation of error using each of the EC genes and the combination of PPIA and B2M

E N D
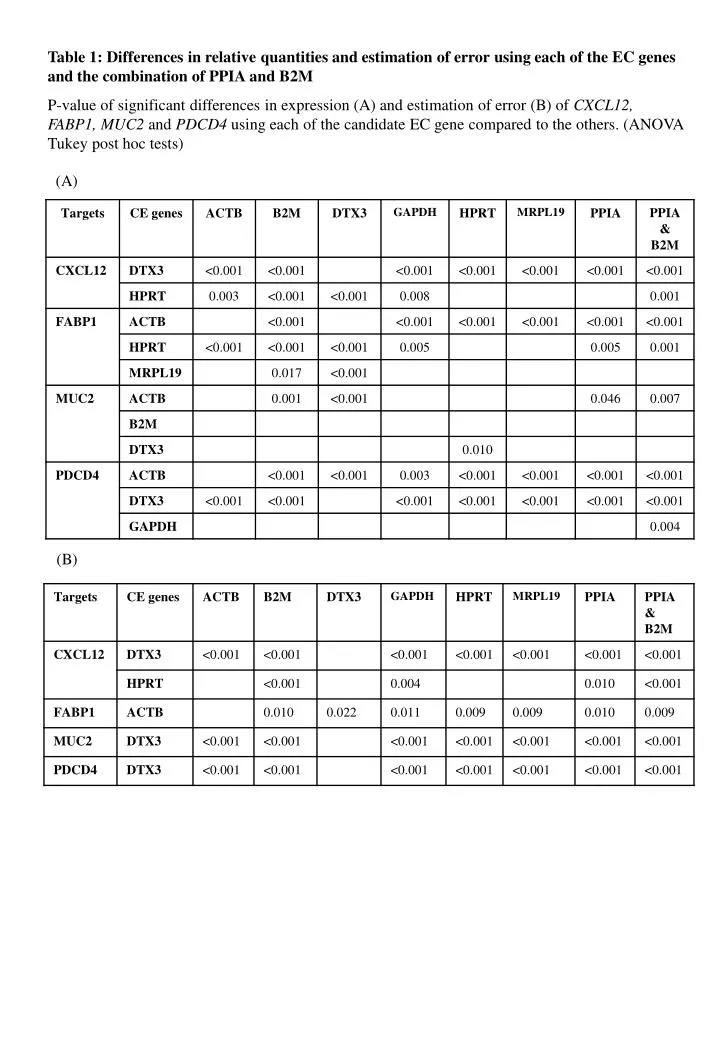
Table 1: Differences in relative quantities and estimation of error using each of the EC genes and the combination of PPIA and B2M P-value of significant differences in expression (A) and estimation of error (B) of CXCL12, FABP1, MUC2 and PDCD4 using each of the candidate EC gene compared to the others. (ANOVA Tukey post hoc tests) (A) (B)