Download
1 / 13
130 likes | 237 Views
Chapter 1 – An Introduction to Business Statistics. Let’s say I am interested in every person who is in the city limits of Wayne, Nebraska at the point in time January 10, 2012 at 12:30pm.

E N D
Let’s say I am interested in every person who is in the city limits of Wayne, Nebraska at the point in time January 10, 2012 at 12:30pm. Just for kicks, let’s imagine at this time that every person in the city limits at this time is frozen in place. It would be like freezing the video of a movie at a particular frame. Let’s say then that you and I can walk around while all the rest of the folks in town are frozen in place. But, when we get to a person we can talk to them. Say we ask each personwhat was their income in 2011, what was their age on January 1, 2012, how much do they like Coca Cola (and the person has to answer either “hate it,” “its okay,”, or “I love it.”), what continent would you like to live on in 2013 (and you have to say 1 of the 9 ;).
Data As we talk to each person we could record their responses. We would probably want to be organized, so let’s use the following (note each row represents measurements on elements and each colum is variable): PersonIncome AgeCoke Continent Person 1 23,750 22Love it North America Person 2 72,800 54 Hate itAsia Person 335,432 36 Hate it North America Person 4 10,000 29its okay Europe We would have data on more people when we are done.
Elements • Any data set provides information about some group of individual elements. • In my example, the folks in Wayne at the specified time are the elements. • In other studies the elements can be people, states, organizations, objects, and many other things.
What is a variable? Each element in a data set may have 1 or more characteristics of interest. Each characteristic would be called a vaiable. For any variable in a study each element has to be assigned a valule. So each element has a “measurement” taken and the value is assigned. For the most part, in our class the measurements have already taken place. We tend to look at variables on subjects or elements in which we are interested. Each element has a value on each variable.
Qualitative or Categorical variable The variable I labeled Coke, which is really about how much each person likes Coke, in our example is an example of a qualitative or categorical variable. The data, or observed values, from the people on the variable just yield a categorical response. Note that sometimes in a data set numbers may be used to express the values on the variable, but all we really have are categories of responses. For example, we could have 1 = hate it, 2 = its okay, 3 = love it and in the data set all you would see are the numbers. But, the numbers really just represent a different category.
Quantitative or Numerical variable In our example the variable Income is an example of a quantitative or numerical variable. The data, or observed values, from the people on the variable yield a numerical response. What type of variable is Age and what type is Continent? Hint: 1 is qualitative and 1 is quantitative.
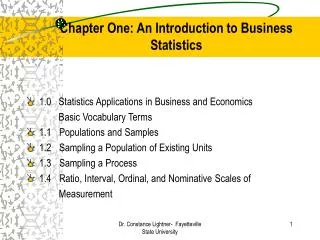
Population Often in statistics we are interested in a group. The group may be large, or even huge! Plus we want to be able to make statements or draw conclusions about the group. A population is the set of all elements we want to study or know something about. So, the population is the main group we want to know about or draw conclusions about. A census is conducted if we have measurements on all the elements in a population. Remember, an element is a single entity of the population.
Sample Many times in a study all the elements of the population will not be observed, so a sample is said to have been taken. A sample is a subset of the elements of a population – just part of the population.
Descriptive Statistics Describing data is a big part of statistics. A fair amount of time will be spent in this class describing data by calculating measures such as the mean and the standard deviation and we might use tables and graphs to assist in learning about the elements of the study. Descriptive statistics is the science of describing the important aspects of a set of measurements.
Inferential Statistics Inferential Statistics is a method used when only a sample from a population has been drawn, but we want to make statements about the important aspects of the larger population. Any cooks reading this? In order to tell if a pot of soup is ready to go, is taking a sample okay? Sure it is, but first make sure you have stirred the soup to mix in the ingredients. In statistics, we feel pretty good about samples as long as we have “mixed” things well.
Examples Say we want to study faculty salaries at WSC. Our research topic is faculty salaries. The population is WSC faculty. Elements are individual faculty. Parker is an element of the population, as is Lutt, Paxton, Nelson, and others. Another example might be we want to study the budgets of state governments. The population is all 50 states. The elements are the states. What are the elements? (Did you say something like Ohio, Nebraska, Iowa….?) Our interest may be people, companies, states, etc…
A note on data and our class During the term you will work on many problems in the book (hopefully more than just the ones I assign). You can assume the data in the problem has been collected properly. As you work a problem focus your attention on the concepts in the chapter and try not to get lost in the application to which the problem refers.