Download
1 / 51
1.29k likes | 3.35k Views
Business Statistics. Chapter 1 Introduction to Statistics and Data Collection. History of statistics. William Petty (English 1623-1687) He developed early human statistical and census methods. History of statistics. Blaise Pascal (French 1623 – 1662)

E N D
Business Statistics Chapter 1Introduction to Statistics and Data Collection Tran Van Hoang - hoangtv@ftu.edu.vn - Business Statistics
History of statistics William Petty (English 1623-1687) • He developed early human statistical and census methods Tran Van Hoang - hoangtv@ftu.edu.vn - Business Statistics
History of statistics Blaise Pascal(French 1623 – 1662) • The mathematical foundations for the subject heavily drew on the new probability theory Tran Van Hoang - hoangtv@ftu.edu.vn - Business Statistics
History of statistics Bernoulli (1655-1705, Switzerland) In his book Bernoulli introduced the idea of representing complete certainty as one and probability as a number between zero and one Tran Van Hoang - hoangtv@ftu.edu.vn - Business Statistics
History of statistics Pierre de Laplace(French,1749-1827) • He made the first attempt to deduce a rule for the combination of observations from the principles of the theory of probabilities. • He represented the law of probability of errors by a curve Tran Van Hoang - hoangtv@ftu.edu.vn - Business Statistics
History of statistics Karl Pearson (England,1857 –1936) • He has underpins many of the 'classical' statistical methods which are in common use today, including the Correlation coefficient, Pearson's system of continuous curves that forms the basis of the now conventional continuous probability distributions; Chi distance, P-value Tran Van Hoang - hoangtv@ftu.edu.vn - Business Statistics
History of statistics Ronald Aylmer Fisher(1890-1962) • In addition to analysis of variance, Fisher named and promoted the method of maximum likelihood estimation. (1924) presented Pearson's chi-squared test, and his own parameter in the analysis of variance Fisher's z-distribution Tran Van Hoang - hoangtv@ftu.edu.vn - Business Statistics
Chapter Goals After completing this chapter, you should be able to: • Describe key data collection methods • Know key definitions: Population vs. Sample Primary vs. Secondary data types Qualitative vs. Quantitative data Time Series vs. Cross-Sectional data • Explain the difference between descriptive and inferential statistics • Describe different sampling methods Tran Van Hoang - hoangtv@ftu.edu.vn - Business Statistics
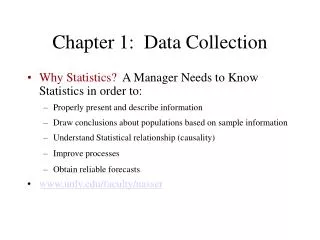
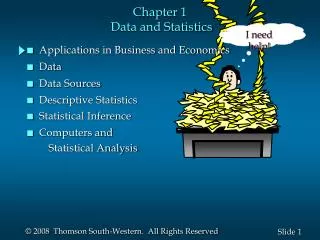
What is statistics? • Statistics is the science that deals with the collection, description, analysis, interpretation, and presentation of data. • Statistics can be used to describe a particular data set as well as to draw conclusions about the population from a particular data set. Tran Van Hoang - hoangtv@ftu.edu.vn - Business Statistics
Tools of Business Statistics • Descriptive statistics • Collecting, presenting, and describing data • Inferential statistics • Drawing conclusions or making decisions concerning a population based only on sample data • Predict and forecast values of population parameters • Test hypotheses about values of population parameters Tran Van Hoang - hoangtv@ftu.edu.vn - Business Statistics
Descriptive Statistics • Collect data • e.g., Survey, Observation, Experiments • Present data • e.g., Charts and graphs • Characterize data • e.g., Sample mean = Tran Van Hoang - hoangtv@ftu.edu.vn - Business Statistics
Data Sources Primary Data Collection Secondary Data Compilation Print or Electronic Observation Survey Experimentation Tran Van Hoang - hoangtv@ftu.edu.vn - Business Statistics
Survey Design Steps • Define the issue • what are the purpose and objectives of the survey? • Define the population of interest • Formulate survey questions • make questions clear and unambiguous • use universally-accepted definitions • limit the number of questions Tran Van Hoang - hoangtv@ftu.edu.vn - Business Statistics
Survey Design Steps (continued) • Pre-test the survey • pilot test with a small group of participants • assess clarity and length • Determine the sample size and sampling method • Select Sample and administer the survey Tran Van Hoang - hoangtv@ftu.edu.vn - Business Statistics
Types of Questions • Closed-end Questions • Select from a short list of defined choices Example: Major: __business __liberal arts __science __other • Open-end Questions • Respondents are free to respond with any value, words, or statement Example: What did you like best about this course? • Demographic Questions • Questions about the respondents’ personal characteristics Example: Gender: __Female __ Male Tran Van Hoang - hoangtv@ftu.edu.vn - Business Statistics
Populations and Samples • A Population is the set of all items or individuals of interest • Examples: All likely voters in the next election All parts produced today All sales receipts for November • A Sample is a subset of the population • Examples: 1000 voters selected at random for interview A few parts selected for destructive testing Every 100th receipt selected for audit Tran Van Hoang - hoangtv@ftu.edu.vn - Business Statistics
Population vs. Sample Population Sample a b c d ef gh i jk l m n o p q rs t u v w x y z b c g i n o r u y Tran Van Hoang - hoangtv@ftu.edu.vn - Business Statistics
Why Sample? • Less time consuming than a census • Less costly to administer than a census • It is possible to obtain statistical results of a sufficiently high precision based on samples. Tran Van Hoang - hoangtv@ftu.edu.vn - Business Statistics
Sampling Techniques Samples Probability Samples Non-Probability Samples Simple Random Systematic Judgement Cluster Convenience Stratified Tran Van Hoang - hoangtv@ftu.edu.vn - Business Statistics
Statistical Sampling • Items of the sample are chosen based on known or calculable probabilities Probability Samples Simple Random Stratified Systematic Cluster Tran Van Hoang - hoangtv@ftu.edu.vn - Business Statistics
Simple Random Samples • Every individual or item from the population has an equal chance of being selected • Selection may be with replacement or without replacement • Samples can be obtained from a table of random numbers or computer random number generators Tran Van Hoang - hoangtv@ftu.edu.vn - Business Statistics
Stratified Samples • Population divided into subgroups (called strata) according to some common characteristic • Simple random sample selected from each subgroup • Samples from subgroups are combined into one Population Divided into 4 strata Sample Tran Van Hoang - hoangtv@ftu.edu.vn - Business Statistics
Systematic Samples • Decide on sample size: n • Divide frame of N individuals into groups of k individuals: k=N/n • Randomly select one individual from the 1st group • Select every kth individual thereafter N = 64 n = 8 k = 8 First Group Tran Van Hoang - hoangtv@ftu.edu.vn - Business Statistics
Cluster Samples • Population is divided into several “clusters,” each representative of the population • A simple random sample of clusters is selected • All items in the selected clusters can be used, or items can be chosen from a cluster using another probability sampling technique Population divided into 16 clusters. Randomly selected clusters for sample Tran Van Hoang - hoangtv@ftu.edu.vn - Business Statistics
Key Definitions • A population is the entire collection of things under consideration • A parameter is a summary measure computed to describe a characteristic of the population • A sample is a portion of the population selected for analysis • A statistic is a summary measure computed to describe a characteristic of the sample Tran Van Hoang - hoangtv@ftu.edu.vn - Business Statistics
Inferential Statistics • Making statements about a population by examining sample results Sample statisticsPopulation parameters (known) Inference(unknown, but can be estimated from sample evidence) Tran Van Hoang - hoangtv@ftu.edu.vn - Business Statistics
Inferential Statistics Drawing conclusions and/or making decisions concerning a populationbased on sample results. • Estimation • e.g., Estimate the population mean weight using the sample mean weight • Hypothesis Testing • e.g., Use sample evidence to test the claim that the population mean weight is 120 pounds Tran Van Hoang - hoangtv@ftu.edu.vn - Business Statistics
Data Types Examples: • Marital Status • Political Party • Eye Color (Defined categories) Examples: • Number of Children • Defects per hour (Counted items) Examples: • Weight • Voltage (Measured characteristics) Tran Van Hoang - hoangtv@ftu.edu.vn - Business Statistics
Data Types Tran Van Hoang - hoangtv@ftu.edu.vn - Business Statistics
Data Types Tran Van Hoang - hoangtv@ftu.edu.vn - Business Statistics
Data Types Tran Van Hoang - hoangtv@ftu.edu.vn - Business Statistics
Data Types Tran Van Hoang - hoangtv@ftu.edu.vn - Business Statistics
Data Types Tran Van Hoang - hoangtv@ftu.edu.vn - Business Statistics
Data Types Tran Van Hoang - hoangtv@ftu.edu.vn - Business Statistics
Data Types • Time Series Data • Ordered data values observed over time • Cross Section Data • Data values observed at a fixed point in time Tran Van Hoang - hoangtv@ftu.edu.vn - Business Statistics
Data Types Time Series Data Cross Section Data Tran Van Hoang - hoangtv@ftu.edu.vn - Business Statistics
Data Measurement Levels Highest Level Complete Analysis Measurements Ratio/Interval Data Rankings Ordered Categories Higher Level Mid-level Analysis Ordinal Data Categorical Codes ID Numbers Category Names Lowest Level Basic Analysis Nominal Data Tran Van Hoang - hoangtv@ftu.edu.vn - Business Statistics
Data Measurement Levels Tran Van Hoang - hoangtv@ftu.edu.vn - Business Statistics
Data Measurement Levels Tran Van Hoang - hoangtv@ftu.edu.vn - Business Statistics
Data Measurement Levels Tran Van Hoang - hoangtv@ftu.edu.vn - Business Statistics
Data Measurement Levels Tran Van Hoang - hoangtv@ftu.edu.vn - Business Statistics
Data Measurement Levels Tran Van Hoang - hoangtv@ftu.edu.vn - Business Statistics
Data Measurement Levels Tran Van Hoang - hoangtv@ftu.edu.vn - Business Statistics
Data Measurement Levels Tran Van Hoang - hoangtv@ftu.edu.vn - Business Statistics
Data Measurement Levels Tran Van Hoang - hoangtv@ftu.edu.vn - Business Statistics
Data Measurement Levels Tran Van Hoang - hoangtv@ftu.edu.vn - Business Statistics
Data Measurement Levels Tran Van Hoang - hoangtv@ftu.edu.vn - Business Statistics
Chapter Summary • Reviewed key data collection methods • Introduced key definitions: Population vs. Sample Primary vs. Secondary data types Qualitative vs. Quantitative data Time Series vs. Cross-Sectional data • Examined descriptive vs. inferential statistics • Described different sampling techniques • Reviewed data types and measurement levels Tran Van Hoang - hoangtv@ftu.edu.vn - Business Statistics
Exercises 1.16 USA Today (Dec.12.1998) reported that 8 out of 10 adults said that they would give to charities during the Christmas season. What data collection method do you think was used to collect this data? Explain your answer. Tran Van Hoang - hoangtv@ftu.edu.vn - Business Statistics
Exercises 1.36 If a manager surveys a sample of 100 customers to determine how many miles they live from the store, is the mean travel distance for this sample considered a parameter or a statistic? Explain 1.40 An Ernts & Young survey of 1363 consumers and more than 120 retailers and consumer-goods manufacturers indicated that in 2001, 12% of retailers sold online to consumers. Is this percentage a statistics? Explain. Tran Van Hoang - hoangtv@ftu.edu.vn - Business Statistics