Download
1 / 19
190 likes | 320 Views
Ozone and fine particulate forecasting for Evansville, Indiana. Joanne Alexandrovich, PhD Vanderburgh County Health Department jalexandrovich@vanderburghgov.org. Where is Evansville?. SW Indiana north of Henderson, KY across the Ohio River east of southern Illinois

E N D
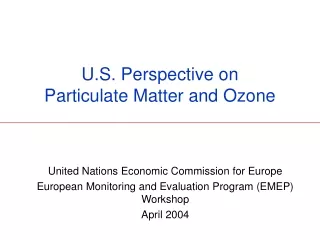
Ozone and fine particulate forecasting for Evansville, Indiana Joanne Alexandrovich, PhD Vanderburgh County Health Department jalexandrovich@vanderburghgov.org
Where is Evansville? • SW Indiana • north of Henderson, KY across the Ohio River • east of southern Illinois • blue dots = ozone monitor location • yellow dots = PM2.5 monitor location • red circle drawn with 100 km radius from central Evansville
Notification of the public to imminent adverse air quality in Evansville: • The first “air quality forecasts” took the form of Ozone Alerts. • The decision to issue a public notice about air quality has always been collaborative between State and Local representatives.
Early Ozone Alerts in Evansville were: • First declared in 1993 (15 years ago). • Based on the 1-hr 0.120 ppm standard. • Issued when 1-hr readings reached 100 ppb, or likely (forecasted) to approach 120 ppb. • Essentially voluntary episodic control programs. Business and industry were recruited to put together emissions reduction plans to implement during the alerts. • The public was also asked to refrain from idling and to wait to gas up their cars until evening. A health message was also included with the Alert
After the 1997 8-hour ozone standard was promulgated but stuck in statutory limbo due to court challenges: • We continued to call Ozone Alerts for the 1-hour standard • “Ozone Advisories” were called when exceedances of 85 ppb (8-hr) were anticipated Once the 1997 ozone standard passed all legal hurdles and upheld by the Supreme Court, we used only the 85 ppb (unhealthy for sensitive groups) benchmark for issuing Ozone Alerts.
Along comes the • The message of our Alerts to reduce emissions clearly became secondary to the message to take action to reduce exposure to protect health. • In 1999 we began to submit daily category forecasts for ozone to AirNow, and post them on IDEM’s website. • In 2003 we rolled out PM2.5 forecasts along with many other cities across the country. • Due to technical issues with our continuous PM2.5 monitor (it consistently was biased high) we issued moderate forecasts until late 2004 when the issues with the monitor were resolved.
The standards are lowered again • The first PM2.5 air quality alerts (or combined Ozone and Particulate Alerts) were called in 2005, based on the daily PM2.5 AQI of 40 µg/m3. • In 2006 after the daily PM2.5 standard was lowered from 65 to 35 µg/m3 we began to use the standard rather than the AQI benchmark to call PM2.5 air quality alerts. • In 2007, in anticipation of a more stringent ozone standard, we began providing numerical ozone forecasts along with categorical forecasts on our local website. • We continued to notify the public with Ozone Alerts when exceedances of 85 ppb (8-hr) were anticipated until 2008 when the new standard took effect.
Forecast reporting • Reported categorical forecasts of good, moderate or USG reflect consensus of the forecast discussion team. • Numerical forecasts are reported locally and AQI numbers are input into AirNow. Forecast table on the local website: www.vanderburghgov.org/Index.aspx?page=1670
Forecasting tools • Our latest categorical and numerical forecasts are based on qualitative assessments of information obtained from many sources including: • current air quality and meteorological conditions • model generated forecasts of weather and pollution levels • air parcel back trajectories • Some tools used are not so typical, and developed specifically for Evansville
Pollution levels as a function of maximum temperatures in Evansville For ozone, exceedances have been documented when temperatures reach a certain threshold (80 °F for exceedances of the 85 ppb 8-hr standard). Once that threshold is met, there is little relationship between temperature and ozone.
Synoptic conditions are more reliable predictors than temperature Five recognizable and repetitive weather patterns have been identified as conducive to the formation of high levels of ozone in the Evansville area. These patterns are characterized by:
Forecasted maximum temperatures are a useful guide for forecasting PM2.5
Factors that affect measures of forecast accuracy • Local- and micro-climatological variability • Fluctuations in emissions of ozone and particulate precursors • Deployment of EGU pollution controls • How often forecasts are made • “Erring on the side of caution” • Due to inherent unpredictability, we will (after much discussion) generally issue pollution alerts even when there is doubt that exceedances will occur. • Occasionally we will issue a “persistence” Alert. If conditions tomorrow will be like today, the team might decide to continue the Alert so as not to confuse the public, even though our team is confident no standards will be exceeded.
Verifying forecast performance • Tracking spreadsheets are set up to automatically calculate several standard statistical parameters for category forecasts of moderate and unhealthy for sensitive groups levels (Ozone or Particulate Alerts) including: • bias • false alarm rate • probability of detection • critical success index • Overall Accuracy is also calculated to determine the ratio of the number forecasts we got correct vs. the number we got wrong • Forecast statistics are assessed on a weekly, monthly, and annual basis.
The verification statistics show: • Overall accuracy and bias do not change measurably from year to year or month to month. • bias averages at ~2 showing the tendency to over predict. Protocol requires us to be conservative and err on the side of caution. • accuracy averages at ~70, which is not bad, but leaves room for improvement. • The false alarm rate, probability of detection, and the critical success index are much more variable. • With respect to moderate PM2.5 category forecasts, CSI & POD increase while FAR decreases during the summer pollution season, suggesting we have improved forecast skill when the likelihood of recording moderate air quality is high.
Numerical forecasting • Ozone monitors in the region display considerable variability on any day, and studies have found no clear relationship with between site to site monitored values and meteorology or emission sources. • Therefore, the numerical forecasts consist of a 10 ppb range of expected peaks to reflect the variability of monitor readings in the area. • The AQI category forecast reported is tied to the highest value of the forecast range. • At the beginning of 2008 ozone season, Evansville joined EnviroFlash, which forced us to supply AQI numbers for PM2.5 so that we could control whether PM2.5 or ozone was listed as the primary pollutant. • Numerical PM forecasts are still in the experimental stage.
The success of numerical forecasting • For now, we don’t calculate forecast verification statistics to asses the skill of our numerical forecasting. • Results are assessed graphically. 2007 Ozone 2008 Ozone
In search of a perfect forecast • I’m highly skeptical we’ll ever be able to issue flawless forecasts for Evansville. • Weather and emissions vary on scales too small (both in space and time) to discern. • Members of our forecast team commonly disagree on expected pollution levels, suggesting our knowledge of the controlling factors of air quality has much room for improvement . (I have not compared the success scores between myself and our team leader to measure our individual knowledge.)
Questions? Comments? Joanne Alexandrovich, PhD Vanderburgh County Health Department jalexandrovich@vanderburghgov.org