Download
1 / 24
240 likes | 402 Views
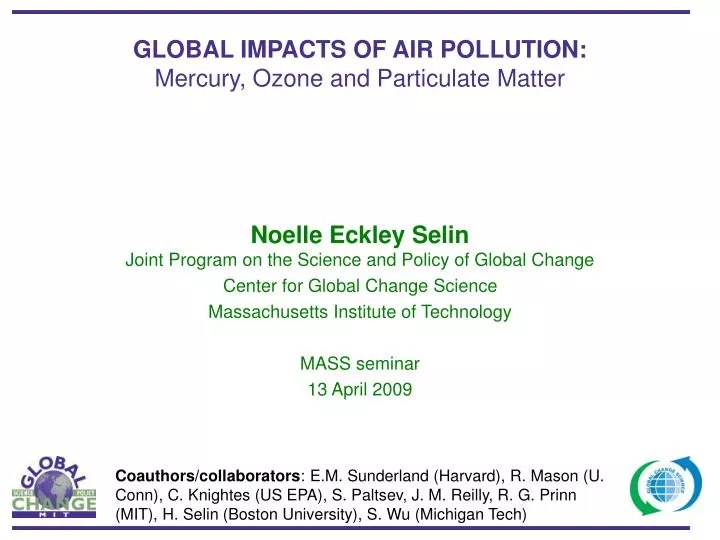
GLOBAL IMPACTS OF AIR POLLUTION: Mercury, Ozone and Particulate Matter. Noelle Eckley Selin Joint Program on the Science and Policy of Global Change Center for Global Change Science Massachusetts Institute of Technology MASS seminar 13 April 2009.

E N D
GLOBAL IMPACTS OF AIR POLLUTION: Mercury, Ozone and Particulate Matter Noelle Eckley SelinJoint Program on the Science and Policy of Global Change Center for Global Change Science Massachusetts Institute of Technology MASS seminar 13 April 2009 Coauthors/collaborators:E.M. Sunderland (Harvard), R. Mason (U. Conn), C. Knightes (US EPA), S. Paltsev, J. M. Reilly, R. G. Prinn (MIT), H. Selin (Boston University), S. Wu (Michigan Tech)
FROM ATMOSPHERE TO FISH: MERCURY RISING Mercury deposition has increased by 300% since industrialization Major anthropogenic source is stationary combustion (coal) Atmospheric transport and deposition leads to high fish methylmercury Ice core from Wyoming [Schuster et al., ES&T 2002]
AIR POLLUTION AND CLIMATE LINKAGES Ozone, aerosols have climate impacts, and are emitted from some of the same sources as greenhouse gases Ozone, fine particulates also have health impacts (cardiovascular/respiratory impacts, acute mortalities) CO2, NOx, etc. [IPCC, 2007] Policies to reduce GHGs could have co-benefits for urban and regional air pollution (or not). How can we understand and quantify these potential benefits?
CONCEPTUAL FRAMEWORK FOR POLLUTANT IMPACTS Atmospheric modeling Emissions of NOx, VOCs, SO2, BC, OC, Hg, GHGs Concentrations of ozone, particulates Hg deposition Pollutant transport Atmospheric chemistry Climate interactions Integrated models & tools Population health impacts Economic modeling Economic activities and Policy choices Hospital visits Mortalities (acute/chronic) IQ deficits Pollution controls Technology changes
RESEARCH QUESTIONS: OUTLINE • How can we use coupled atmospheric and ecosystem models to assess the impacts of mercury pollution? • What are the potential future health impacts of air pollution at a global scale?
GLOBAL BIOGEOCHEMICAL CYCLE OF MERCURY [Selin et al. GBC 2008; Selin, Ann. Rev. Env. Res., 2009]
DEPOSITION PATTERNS IN THE UNITED STATES Highest Emission: Ohio River Valley Highest Deposition: Florida/Gulf Coast Why doesn’t the area of highest Hg(II) emission have the highest deposition? GEOS-Chem captures magnitude and spatial variation of measured wet deposition We can use the model to gain insights into deposition processes. [Measurements: Mercury Deposition Network; Model: Selin & Jacob, AE 2008]
NORTH AMERICAN VS. INTERNATIONAL DEPOSITION Results from GEOS-Chem global land-ocean-atmosphere Hg model [Selin et al., 2007, 2008] Up to 60% of deposition in Midwest/Northeast is from domestic sources Florida has highest deposition in the U.S., but mostly from non-US sources Policy implications: Reducing deposition in both Midwest and Southeast will require policy actions on multiple political scales (national and global) [Selin & Jacob, AE 2008]
FROM DEPOSITION TO FISH METHYLMERCURY [Engstrom, 2007]
9% 32% 23% 59% 11% 66% FRESHWATER DEPOSITION AND SOURCE ATTRIBUTION How do sources affect fish methylmercury, and on what timescales? Northeast U.S. Southeast U.S. International Anthropogenic 24.21 g m-2 y-1 34.08 g m-2 y-1 Pre-industrial + Historical N. American Anthropogenic SERAFM: Lake model WASP7: River model WCS (MLM): Watershed loading BASS: Aquatic food web [Knightes et al., 2009] Policy and Timescale Analysis [Selin et al., EHP, submitted]
FRESHWATER TIMESCALE ANALYSIS Each ecosystem driven by present-day deposition for 40 years Policy experiment: All Hg is “historical” at t=0. How is anthropogenic signal reflected in fish, and on what timescale? Ecosystem A Fish MeHg (ppm) Same deposition,but different ecosystem dynamics lead to very different source attributions (and concentrations) over time (watershed role) Ecosystem B Note difference in scale! Regional differences in deposition sources lead to different attributions in similar ecosystems [Selin et al., EHP, submitted]
LOCAL EXPOSURE FROM FRESHWATER FISH 2 x 100 g fish meals/week (60 kg person) @ t=40 y 6.4 North American anthropogenic International anthropogenic Historical+Natural WHO intake threshold EPA Reference Dose Ecosystem A Ecosystem A Ecosystem B Ecosystem B Southeast Northeast [Selin et al., EHP, submitted]
POPULATION-WIDE EXPOSURE FROM MARINE FISH No mechanistic link (yet) from oceanic Hg concentration to fish methylmercury Historical exposure could continue to increase, complicating policy decision-making Different challenges on different scales (local to global) Adaptation and mitigation necessary? (Learning lessons from other issue areas) “current emissions” scenario 14-box ocean model: Sunderland and Mason, 2007 [Selin et al., EHP, submitted]
RESEARCH QUESTIONS: OUTLINE • How can we use coupled atmospheric and ecosystem models to assess the impacts of mercury pollution? • What are the potential future health impacts of air pollution at a global scale?
FUTURE OZONE : CLIMATE & EMISSIONS [Wu et al., 2008]
MIT EPPA HEALTH EFFECTS MODEL Emissions Prediction and Policy Analysis model: general equilibrium economic model Concentration of O3, [particulates] (data, model): Population-weighted concentration per global region (16 regions) Morbidity and mortality outcomes and costs, ozone (EU Extern-E, 2005) Loss of labor, capital and equilibrium economic effects (2000-2100) EPPA-HE US model: Matus et al., Climatic Change, 2008
POPULATION-WEIGHTED OZONE CONCENTRATIONS Emissions: IPCC A1B scenario [GEOS-Chem model: Wu et al, 2008; Selin et al. in prep]
CHANGES IN POPULATION-WEIGHTED OZONE Population-weighted ozone concentration by EPPA region, ppb
ECONOMIC IMPACTS ($2000, billions) One-third of costs are from accumulated economic burden of previous concentrations!
ECONOMIC ANALYSIS OF HG EXPOSURE • IQ deficits from mercury exposure [Axelrad, 2007] cost 2.5% of income per point lost [Salkever, 1995] • Calculate additional cost of US emissions for general population (marine) exposure beginning in 2000 Other estimates: $1.3b for US power plants alone (Trasande et al., 2005); $119m-4.9b (Rice et al. 2005) [Selin et al., in prep.]
Concentrations of Aerosols Atmospheric Aerosol Model 7 Aerosol modes advection, convection, mixing, wet & dry deposition AGCM: NCAR CCM/CAM + CLM Atmospheric circulation & state clouds & precipitation, radiation Winds, T, H2O, Precipitation & Vertical Fluxes MIT EPPA + Emission Processor OGCM or SSTData Emissions A-O Exchanges The MIT/NCAR Interactive Aerosol-Climate Model (Kim et al., 2008; Wang 2004, 2007; Ekman et al., 2004; Wilson et al., 2001; Barth et al., 2000; Rasch et al., 2000; Mayer et al., 2000; Kiehl et al., 1998; Boville and Gent, 1998) [Slide: C. Wang]
CLIMATE POLICIES AND CO-BENEFITS FOR PM Projected change in annual average PM2.5 (2050-2000) for reference EPPA emissions scenario • Policies to restrict CO2 also reduce BC, OC, SO2. • Scenario: 80% reduction in carbon dioxide in developed countries by 2050, 50% in large developing countries • 30% less SO2, decreased BC and OC • How does the economic benefit of these reductions compare with the cost of the climate actions? (~5 trillion/2050?) g m-3
FUTURE RESEARCH GOALS Challenge: Understand the human impact on the transport and fate of pollutants in the environment • Arctic chemistry and climate: pathways of pollutant transport to the Arctic, including Hg, persistent organic pollutants, Br chemistry • Human impacts on biogeochemical cycles (C/Hg interactions, other metals and elements) • Air chemistry implications of future energy choices, e.g. biofuels