Download
1 / 20
200 likes | 312 Views
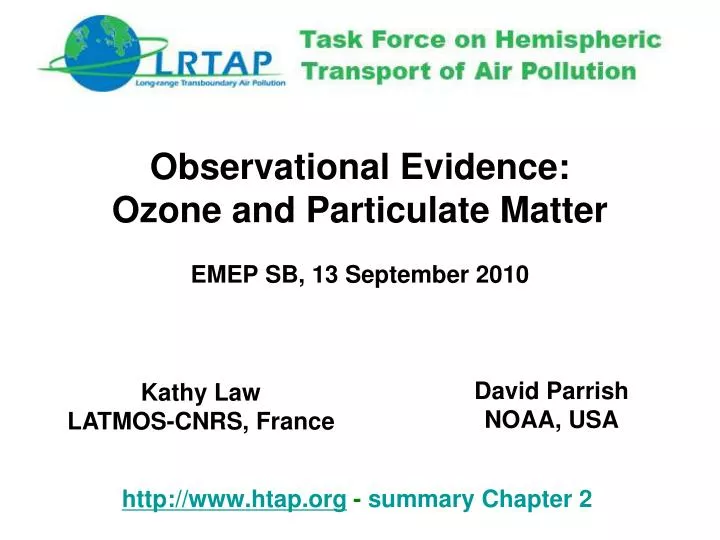
Observational Evidence: Ozone and Particulate Matter EMEP SB, 13 September 2010. http:// www.htap.org - summary Chapter 2. David Parrish NOAA, USA. Kathy Law LATMOS-CNRS, France. Key issue – where is O3 imported into downwind receptor regions?. ΔO3 climate (5-14km).

E N D
Observational Evidence:Ozone and Particulate Matter EMEP SB, 13 September 2010 http://www.htap.org - summary Chapter 2 David Parrish NOAA, USA Kathy Law LATMOS-CNRS, France
Keyissue – where is O3 imported into downwind receptor regions? ΔO3 climate (5-14km) ΔO3 regional AQ/inter-continental transport (0-3km) TF-HTAP From Cooper, chapter A1, HTAP
O3 & PM Observational Evidence Pollution events at surface sites Asian anthropogenic plume seen at Mount Batchelor on west coast US, April 2004 (Jaffe et al., 2005) Aerosol signal equivalent to 20 μg m-3
O3 imported into receptor regions WHO 8-hr health guideline Baseline ozone record (local anthrop. influences removed) Mace Head (west coast Ireland) 1987-2009 vegetation guideline Ozone measurements on west coast of continents show levels approaching or exceeding levels of ambient standards or objectives
Troposphere is full of plumes 12 km 0 km 12 km 0 km January December July MOZAIC data collected on commercial aircraft at Frankfurt during 2003 from 0-12km (1080 profiles) [courtesy Zebinden, Thouret]
Receptor regions see broad spectrum of concentrations Plumes only account for 1-2% of air masses All NH influenced by anthrop. pollution (even at remote sites) « background » often defined as only natural sources - not a very useful concept (especially for O3) Vertical CO and O3 profiles - MOZAIC aircraft @ 2-10km over west coast USA, summer
Issue – how to distinguish imported ozone from local or regional influences? Analysis of natural, inter-continental and local contributions to surface O3 (site in southern England), Derwent et al. (2008)
HTAP 2010 HTAP Ozone Trends • Seasonal averages calculated from monthly mean data (provided by PIs or original hourly/daily data • Linear fit if quadratic term not significant • Spring (MAM) trends strongest • Seasonal trends: different O3 behaviour in different seasons –cancellation of different trend signals in annual trends • Surface & altitude (LT) sites – comparison linear/quadratic fits spring-time ozone trends at remote or high-altitude sites
General Conclusions The Main Messages • Troposphere is full of plumes giving broad distribution of concentrations • Clear observational evidence exists for inter-continental transport of O3 precursors (satellite, aircraft, surface) • Measurements often exceed AQ/health standards for O3 at west coast sites of downwind receptor regions (at least 25% from inter-continental transport) • Rising trends in NH O3 especially downwind of Asia – mixed signatures in other regions
Following slides from Toulouse ozone trends meetingshows figures from updated David’s updated analysis
HTAP 2010 NH ozone trends for TF-HTAP • Surface: Europe (Mace Head*, Zingst-Arkona – Baltic Sea), N. America - Pacific MBL* (several sites) and Japanese MBL (3 sites) • Altitude sites: Europe (Hohenpeissenberg(1km), Arosa (1.8km), Jungfrau(3.6km), Zugspitze(3.0km)), N. America (Lassen (1.8km), MOZAIC (3-8km) – spring only), Japan (Mt. Happo(1.9km)) • * MH and Pacific MBL are baseline concentrations – local continental influences removed
Seasonal ozone trends: linear fits Linear fit trends for the seasons and periods indicated Sites in the interior of Europe were only fit up to 2000. All error bars indicate 95% confidence limits. Generally all trends are positive and statistically significant – except North America in autumn Some indication of increasing trend with altitude. Japan (downwind of east Asia) has stronger trends
Linear Quadratic Baseline record – local influences removed using particle dispersion model & trace gas data Spring/winter O3 concs. much higher than summer/autumn Strongest trend in winter, trends slowing
1.0 km a.s.l. central Europe Winter ozone increasing, at least up to 2000 Indications for ozone levelling off or decreasing since 2000 Spring ozone becoming higher than summer (?) and winter higher than autumn (?) - shift in seasonal cycle?
Rate of change in trends (ppbv/yr/yr) Quadratic fits were made to Plot of coefficient of the second order term from quadratic fits. Generally decreasing trends in Europe and North America, although some not statistically significant, especially North America Japan - no statistically significant indication of changing trends.
Summary & Open Issues • Motivation from TF-HTAP perspective – analysis of measurements O3 downwind from emission regions • Increasing trends in Japan, slowing trends in Europe (LT), North America less clear • Changing seasonal cycles? • Quadratic fits more useful – entire record • Issues – diagnosis of imported fraction
Some additional figures from HTAP Chapter 2 Plus recommendations
O3 & PM Observational Evidence O3 precursors: plume events Forest fire and anthropogenic CO plumes seen by MOPITT Satellite in July 2004 (NRC, 2010)
O3 & PM Observational Evidence Satellite tropospheric O3 Tropospheric ozone column satellite data - mix of long-range Transport, chemical production/loss and natural sources (stratosphere) [Ziemke et al., 2006]
Main Recommendations Future Directions • Continued and improved measurement networks for detection of inter-continental pollution (O3, precursors, PM components) – in particular vertical profile data • Development of finger printing techniques for source attribution (e.g. isotopes, VOC ratios) • Dedicated field experiments, measurements and modelling to improve currently poor understanding about import of pollution into downwind receptor regions