Download
1 / 21
240 likes | 483 Views
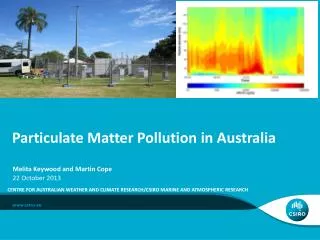
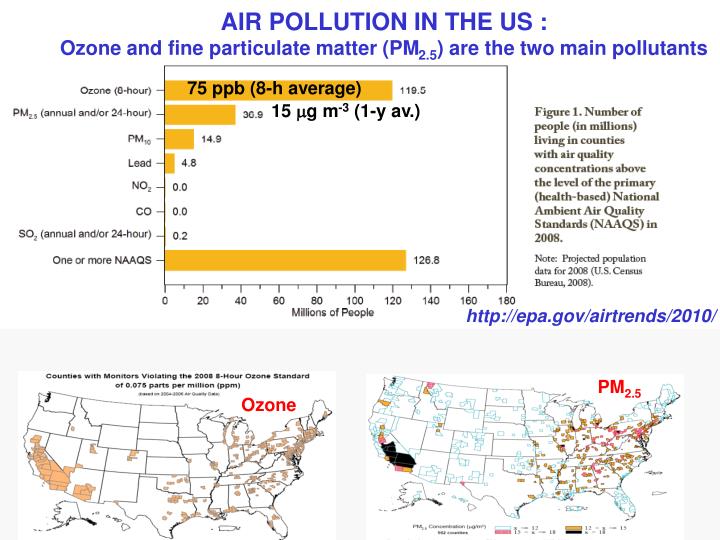
AIR POLLUTION IN THE US : Ozone and fine particulate matter (PM 2.5 ) are the two main pollutants. 75 ppb (8-h average). 15 m g m -3 (1-y av.). http://epa.gov/airtrends/2010/. PM 2.5. Ozone. Ozone air quality standards in the US and in the world. Canadian AQS (8-h avg.). Europe AQS

E N D
AIR POLLUTION IN THE US :Ozone and fine particulate matter (PM2.5) are the two main pollutants 75 ppb (8-h average) 15 mg m-3 (1-y av.) http://epa.gov/airtrends/2010/ PM2.5 Ozone
Ozone air quality standards in the US and in the world Canadian AQS (8-h avg.) Europe AQS (8-h avg.) Mexican AQS (1-h avg.) Europe AQS (seasonal) U.S. AQS (8-h avg.) U.S. AQS (1-h avg.) 2008 1997 2014? 0 20 40 60 80 100 120 ppb Preindustrial ozone background Present-day ozone background at northern mid-latitudes
4th-highest annual maximum for daily 8-h average ozone,2008-2010
OZONE CONCENTRATIONS vs. NOx AND VOC EMISSIONSAir pollution model calculation for a typical urban airshed NOx-limited Ridge NOx- saturated
LARGE SUPPLY OF BIOGENIC VOCs – unrecognized until the 1990s Switches polluted areas in U.S. from NOx-saturated to NOx-limited regime! recognized in Revised Clean Air Act of 1999 Anthropogenic VOCs Isoprene (biogenic VOC) Jacob et al., 1993
MAPPING OF VOC EMISSIONS FROM SPACEusing satellite measurements of formaldehyde confirms dominance of biogenic over anthropogenic VOCs Millet et al. [2008]
1970-2003 TREND OF U.S. EMISSIONS Focus until past decade was on VOC emission controls
OZONE TRENDS IN U.S. http://www.epa.gov/airtrends/ National trend • The national trend is heavily weighted by California sites; • other parts of the country have seen marginal improvement Boston trend
DECREASE OF POWER PLANT NOx EMISSIONSOVER THE PAST DECADE Decreasing US NOx emissions from power plants
Decrease of North American NOx emisssions, 2005-2009 as seen with annual mean NO2 columns from the OMI satellite instrument 2005 2009 Decreases in both the eastern US and eastern Canada Shailesh Kharol (Dalhousie)
EVEN IN NOx-LIMITED REGIME,THE TOTAL O3 PRODUCED IS ONLY A WEAK FUNCTION OF NOx P(O3) L(NOx) HO2,RO2,O3 OH, O3 NO NO2 HNO3 hv Emission Deposition Define ozone production efficiency (OPE) as the total number of O3 molecules produced per unit NOx emitted. Assuming NOx steady state, efficient HOx cycling, and loss of NO2 by reaction with OH: OPE m as NOxk e strong nonlinearity; in models, decreasing NOx emissions by 50% reduces ozone only by ~15%
MEAN AFTERNOON SUMMER OZONE (2006) CASTNet sites (regional background) ppb High ozone concentrations at sites in intermountain west
8-h daily maximum ozone in the intermountain West (2006) GEOS-Chem model US pollution contribution 56.3 ppb 53.2 ppb 12.3 ppb 56.4 ppb 58.1 ppb 15.0 ppb Zhang et al., 2011
North American ozone background over the US defined as the surface ozone concentrations that would be present in the absence of North American anthropogenic emissions 4th highest annual North American background ozone (GEOS-Chem model) Zhang et al. [2011]
Decrease of North American NOxemisssions, 2005-2009 as seen with annual mean NO2 columns from the OMI satellite instrument 2005 2009 Decreases in both the eastern US and eastern Canada Shailesh Kharol (Dalhousie)
Cooper et al. [2012] Spring Summer Daytime surface ozone distributions, 2006-2010
Cooper et al. [2012] Spring Summer Daytime surface ozone trends, 1990-2010
Oil sand recovery In Alberta OMI NO2 columns, 2004-2010 Using OMI observationsto monitor growth in emissions from Canadian oil sands NO2 increase of 10.4 ±3.5% per year McLinden et al. [GRL 2012] AQAST PI: DIckerson
Ozone trends in remote air at northern mid-latitudes D.D. Parrish, NOAA
Rising surface ozone pollution in China D.D. Parrish, NOAA
INTERCONTINENTAL OZONE POLLUTION INFLUENCES GEOS-Chem model results for 2006 Surface O3 enhancements from North American anthropogenic emissions from European anthropogenic emissions from Asian anthropogenic emissions Lin Zhang, Harvard