Download
1 / 1
10 likes | 147 Views
Functional Brain Imaging Study of Central Post-Stroke Pain in Rats Hsiang-Chin Lu 1 , Wei-Jen Chang 1 , Guan-Ying Chiou 2 , Bai Chuang Shyu 1* 1 Institute of Biomedical Sciences, Academia Sinica, Taipei, Taiwan, ROC 2 School of Medicine, Chung Shan Medical University, Taichung, Taiwan, ROC.

E N D
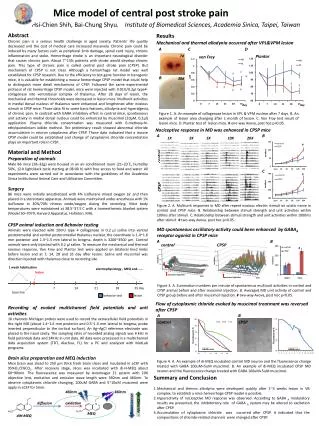
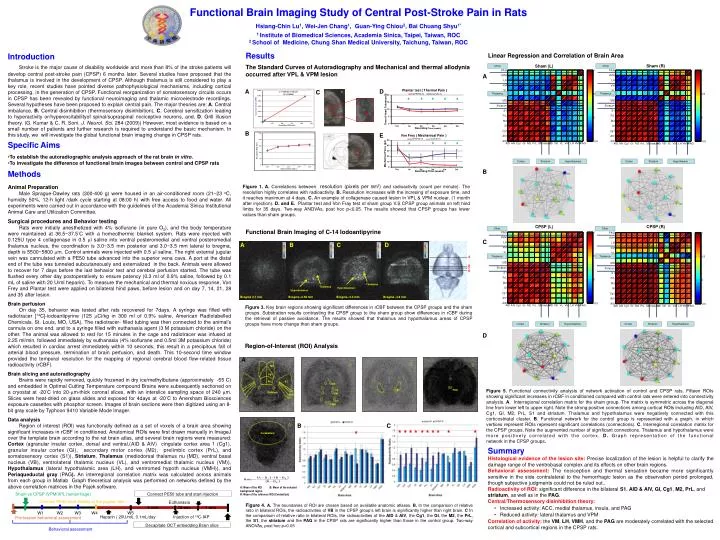
Functional Brain Imaging Study of Central Post-Stroke Pain in Rats Hsiang-Chin Lu1, Wei-Jen Chang1, Guan-Ying Chiou2, Bai Chuang Shyu1* 1 Institute of Biomedical Sciences, Academia Sinica, Taipei, Taiwan, ROC 2 School of Medicine, Chung Shan Medical University, Taichung, Taiwan, ROC R Other Other Other Other Linear Regression and Correlation of Brain Area Thalamus Thalamus Thalamus Thalamus Results The Standard Curves of Autoradiography and Mechanical and thermal allodynia occurred after VPL & VPM lesion Introduction Stroke is the major cause of disability worldwide and more than 8% of the stroke patients will develop central post-stroke pain (CPSP) 6 months later. Several studies have proposed that the thalamus is involved in the development of CPSP. Although thalamus is still considered to play a key role, recent studies have pointed diverse pathophysiological mechanisms, including cortical processing, in the generation of CPSP. Functional reorganization of somatosensory circuits occurs in CPSP has been revealed by functional neuroimaging and thalamic microelectrode recordings. Several hypotheses have been proposed to explain central pain. The major theories are: A. Central imbalance, B. Central disinhibition (thermosensory disinhibition), C. Cerebral sensitization leading to hyperactivity or/hyperexcitabilityof spinal/supraspinal nociceptive neurons, and, D. Grill illusion theory. (G. Kumar & C. R. Soni. J. Neurol. Sci. 284 (2009)) However, most evidence is based on a small number of patients and further research is required to understand the basic mechanism. In this study, we will investigate the global functional brain imaging change in CPSP rats. Sham (R) Sham (L) A A Cortex Striatum Hypothalamus Cortex Striatum Hypothalamus Cortex Striatum Hypothalamus Cortex Striatum Hypothalamus B • Specific Aims • To establish the autoradiographic analysis approach of the rat brain in vitro. • To investigate the difference of functional brain images between control and CPSP rats Methods Animal Preparation Male Sprague-Dawley rats (300-400 g) were housed in an air-conditioned room (21–23 oC, humidity 50%, 12-h light /dark cycle starting at 08:00 h) with free access to food and water. All experiments were carried out in accordance with the guidelines of the Academia Sinica Institutional Animal Care and Utilization Committee. Surgical procedures and Behavior testing Rats were initially anesthetized with 4% isoflurane (in pure O2), and the body temperature were maintained at 36.5~37.5°C with a homeothermic blanket system. Rats were injected with 0.125U type 4 collagenase in 0.5 ml saline into ventral posteromedial and ventral posteromedial thalamus nucleus, the coordination is 3.0~3.5 mm posterior and 3.0~3.5 mm lateral to bregma, depth is 5500~5800 mm. Control animals were injected with 0.5 ml saline. The right external jugular vein was cannulated with a PE50 tube advanced into the superior vena cava. A port at the distal end of the tube was tunneled subcutaneously and externalized in the back. Animals were allowed to recover for 7 days before the last behavior test and cerebral perfusion started. The tube was flushed every other day postoperatively to ensure patency (0.3 ml of 0.9% saline, followed by 0.1 mL of saline with 20 U/ml heparin). To measure the mechanical and thermal noxious response, Von Frey and Plantar test were applied on bilateral hind paws, before lesion and on day 7, 14, 21, 28 and 35 after lesion. Brain perfusion On day 35, behavior was tested after rats recovered for 7days. A syringe was filled with radiotracer [14C]-iodoantipyrine (125 mCi/kg in 300 ml of 0.9% saline, American Radiolabelled Chemicals, St. Louis, MO, USA). The radiotracer- filled tubing was then connected to the animal’s cannula on one end, and to a syringe filled with euthanasia agent (3 M potassium chloride) on the other. The animal was allowed to rest for 15 minutes in the cage and radiotracer was infused at 2.25 ml/min, followed immediately by euthanasia (4% isoflurane and 0.5ml 3M potassium chloride) which resulted in cardiac arrest immediately within 10 seconds, this result in a precipitous fall of arterial blood pressure, termination of brain perfusion, and death. This 10-second time window provided the temporal resolution for the mapping of regional cerebral blood flow-related tissue radioactivity (rCBF). Brain slicing and autoradiography Brains were rapidly removed, quickly frozened in dry ice/methylbutane (approximately -55 C) and embedded in Optimal Cutting Temperature compound Brains were subsequently sectioned on a cryostat at -20°C into 20-mm-thick coronal slices, with an interslice sampling space of 240 mm. Slices were heat-dried on glass slides and exposed for 4days at -20°C to Anersham Biosciences exposure cassettes with phosphor screen. Images of brain sections were then digitized using an 8- bit gray scale by Typhoon 9410 Variable Mode Imager. Data analysis Region of interest (ROI) was functionally defined as a set of voxels of a brain area showing significant increases in rCBF in conditioned. Anatomical ROIs were first drawn manually in ImageJ over the template brain according to the rat brain atlas, and several brain regions were measured: Cortex (agranular insular cortex, dorsal and ventral,(AID & AIV) cingulate cortex area 1 (Cg1), granular insular cortex (GI), secondary motor cortex (M2), prelimbic cortex (PrL), and somatosensory cortex (S1)), Striatum, Thalamus (mediodorsal thalamus nu (MD), ventral basal nucleus (VB), ventrolateral thalamic nucleus (VL), and ventromedial thalamic nucleus (VM)), Hypothalamus (lateral hypothalamic area (LH), and ventromed hypoth nucleus (VMH)), and Periaqueductal gray (PAG). An interregional correlation matrix was calculated across animals from each group in Matlab Graph theoretical analysis was performed on networks defined by the above correlation matrices in the Pajek software. B D C Figure 1. A. Correlations between resolution (pixels per mm2) and radioactivity (count per minute). The resolution highly correlates with radioactivity. B. Resolution increases with the incresing of exposure time, and it reaches maximum at 4 days. C. An example of collagenase caused lesion in VPL & VPM nuclear. (1 month after injection). D. and E. Plantar test and Von Fray test of sham group V.S CPSP group animals on left hind limbs for 35 days. Two-way ANOVAs, post hoc p<0.05. The results showed that CPSP groups has lower values than sham groups. A B C D Functional Brain Imaging of C-14 Iodoantipyrine CPSP (L) CPSP (R) E A C B C D Thalamus Thalamus Hypothalamus Hypothalamus Figure 3. Key brain regions showing significant differences in rCBF between the CPSP groups and the sham groups. Substration results contrasting the CPSP group to the sham group show differences in rCBF during the retrieval of passive avoidance. The results showed that thalamus and hypothalamus areas of CPSP groups have more change than sham groups. A D Region-of-Interest (ROI) Analysis M2 Cg1 PrL S1 MD Figure 5. Functional connectivity analysis of network activation of control and CPSP rats. Fifteen ROIs showing significant increases in rCBF in conditioned compared with control rats were entered into connectivity analysis. A. Interregional correlation matrix for the sham group. The matrix is symmetric across the diagonal line from lower left to upper right. Note the strong positive connections among cortical ROIs including AID, AIV, Cg1, GI, M2, PrL, S1 and striatum. Thalamus and hypothalamus were negatively connected with this corticostriatal cluster. B. Functional network for the control group is represented with a graph, in which vertices represent ROIs represent significant correlations (connections). C. Interregional correlation matrix for the CPSP groups. Note the augmented number of significant connections. Thalamus and hypothalamus were more positively correlated with the cortex. D. Graph representation of the functional network in the CPSP groups. Bregma 2.7 mm Bregma -2.56 mm Bregma -3.3 mm Bregma -4.8 mm VB PAG VL GI Striatum VM AID AIV LH VMH Cerebellum B C • Summary • Histological evidence of the lesion site: Precise localization of the lesion is helpful to clarify the • damage range of the ventrobasal complex and its effects on other brain regions. • Behavioral assessment: The nociception and thermal sensation became more significantly sensitive in the side contralateral to the hemorrhagic lesion as the observation period prolonged, • though subjective judgments could not be ruled out.. • Radioactivity of ROI: significant difference in the bilateral S1, AID & AIV, GI, Cg1, M2, PrL, and striatum, as well as in the PAG. • Central/Thermosensorydisinhibition theory: • Increased activity: ACC, medial thalamus, insula, and PAG • Reduced activity: lateral thalamus and VPM • Correlation of activity: the VM, LH, VMH, and the PAG are moderately correlated with the selected cortical and subcortical regions in the CPSP rats. A: Mean of the ROI B: Mean of the selected background region R: Mean of the reference ROI (Cerebellum) Sham vs CPSP (VPM/VPL hemorrhage) Connect PE50 tube and start injection Connect PE50 tube distally to the jugular vein Euthanasia Figure 4. A. The boundaries of ROI are chosen based on available anatomic atlases. B. In the comparison of relative ratio in bilateral ROIs, the radioactivities of VB in the CPSP group’s left brain is significantly higher than right brain. C In the comparison of relative ratio in bilateral ROIs, the radioactivities of the AID & AIV, the Cg1, the GI, the M2, the PrL, the S1, the striatum and the PAG in the CPSP rats are significantly higher than those in the control group. Two-way ANOVAs, post hoc p<0.05 5 min 10 sec 1 min W1 W2 W3 W4 W5 Heparin ( 20U/ml), 0.1mL/day Injection of 14C-IAP Pre-lession behavioral assessment Decapitate OCT embedding Brain slice Behavioral assessment