Download
1 / 2
160 likes | 554 Views
STROKE: IMAGING. STROKE IMAGING STATISTICS NON-HAEMORRHAGIC STROKE 1. DIFFUSION WEIGHTED IMAGING (DWI ) Sensitivity -90% Specificity -95% Accuracy -90% Positive Predictive Value -100% Negative Predictive Value -50% 2. CT SCANNING (UNCONTRASTED) Sensitivity – 60% Specificity – 65%

E N D
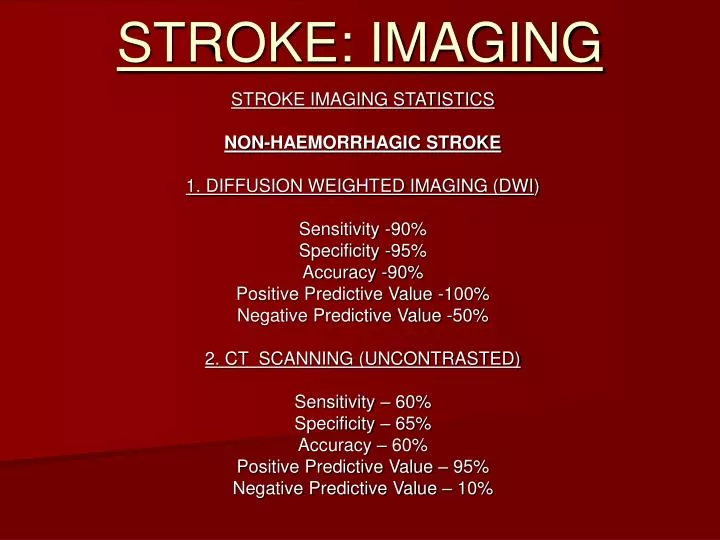
STROKE: IMAGING STROKE IMAGING STATISTICS NON-HAEMORRHAGIC STROKE 1. DIFFUSION WEIGHTED IMAGING (DWI) Sensitivity -90% Specificity -95% Accuracy -90% Positive Predictive Value -100% Negative Predictive Value -50% 2. CT SCANNING (UNCONTRASTED) Sensitivity – 60% Specificity – 65% Accuracy – 60% Positive Predictive Value – 95% Negative Predictive Value – 10%
HAEMORRHAGIC STROKE 1. MRI Sensitivity – 100% Specificity – 100% Please note that care should be taken for the possibility for subarachnoid haemorrhage (SAH) which may be very difficult to see on MRI Scanning. 2. CT SCANNING Sensitivity – 100% Specificity – 100% Please note that abovementioned statistics apply to the hyperacute and acute stages of haemorrhagic stroke. Subacute may be isodense on CT. Chronic micro bleeds are definitely better seen on MRI Scanning compared to CT Scanning.