Download
1 / 63
660 likes | 1.42k Views
Chapter 6. COUNTERCURRENT MULTISTAGE EXTRACTION II. More Applications HETP, HTU, Capacity. Tocopherol - Separation. Structure of Tocochromanols. Solubility of Tocopherols in sc-CO 2. Squalene - Tocopherol - Sterol - Separation. Top Product of Tocopherols.

E N D
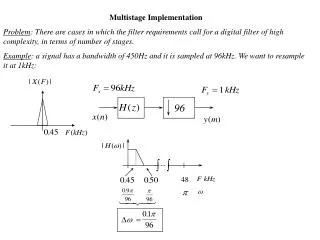
Chapter 6 COUNTERCURRENT MULTISTAGE EXTRACTION II More Applications HETP, HTU, Capacity
Squalene - Tocopherol/Sterol-separation with CO2 99 wt-% squalene 90 wt-% squalene Saure 1996
Squalene/Tocopherols From Distillates Gas, liquid Squalene Tocopherols Sterols Feed Saure 1996 Equilibrium stages
Separation of FFA C16/C18-FFA -CO2 Machado 1998
Purification of Synthetic Tocopherolacetate • Calculation of number of theoretical stages (Jänecke). 333 K, 24 MPa CO2. U. Fleck. Tocopherolacetate.
Purification of Synthetic Tocopherolacetate • Determination of nth in dependence on reflux ratio for different purities. (McCabe-Thiele and Jänecke); 333 K, 16 MPa CO2. . U. Fleck.
Purification of Synthetic Tocopherolacetate • Concentration profiles along column length; 333 K, 20 MPa CO2. U. Fleck.
Separation Factor: Influence of Concentration • Variation of K-factors (left) and separation factors (right) with column length. 370 K; 23 MPa. Left: = Squalen, = FAE, = FFA; Right: = aFAE, Squalen, = aFFA, Squalen. D. Buß, 2001
Separation Analysis: FFA, Toco - Triglycerides, Carotene Solvent ratio / (kg reflux / kg extract
Orange Peel Oil Representation of an improved separation factor model at 333 K. M. Budich
Orange Peel Oil: Removal of Terpenes Budich 1998
No Aceotrope in Ethanol - Water Budich, 1998
Ethanol - Water Calculation of the theoretical number of stages. M. Budich.
Mixer-Settler (5 Stages) Flow Scheme of Mixer-Settler. M. Jungfer, 2000. Design: Trepp, ETH-Zürich
Mixer-Settler, Single Stage Mixer-Settler-Module No. n. M. Jungfer, 2000. Design: Trepp, ETH-Zürich
Solvent Cycle: Solvent to Feed Ratio of SFE Processes Countercurrent Separation V/LvS / F FAEE, FAME (5 %) 20 7.5 125 FFA (fatty acids) (2 %) 50 4.5 50 Squalene (1.5 %) 20 10 50 Tocopherol-Purif. (2.5 %) 35 20 45 Solvent ratio V/L, kg/kg Reflux ratio v, - Solvent to feed ratio S/F, kgF /kgF Basis: Solvent: Carbon dioxide 10 - 30 MPa, 350 K
Solubility and Solvent to Feed Ratio Relationship between loading and solvent-to-feed ratio. M. Budich. Orange peel oil.
Means for reducing costs Enhance solubility in solvent: Pressure, temperature other solvent (C3H8 vs. CO2) Reduce energy for solvent cycle: low p for extract recovery
Purification of Tocopherol:CO2-Propane Temp. Solubility Selectivity 10 % Propane initial feed mixture Solubility Selectivity Density Fleck 1998
Purification of tocopherol:CO2-Propane Propane,10 MPa Propane, 9 MPa Propane, 9 MPa Solvent ratio = 30 Solvent ratio = 70 Reflux ratio Fleck, 1999
Some Data on Solvent Cycle Costs High vacuum distillation: 100 % p Solvent: CO2 200 % Solvent: CO2 + C3H8 20 % Adsorption: Solvent: CO2 50 % Solvent: CO2 + C3H8 8 %
HETP, HTU FA-ethyl esters - CO2 Riha 1996
HETP: Tocopherol • HETP (Jänecke) vs solvent ratio in stripping section. Saure, 1996
HETS for aqueous mixtures M. Budich
Pressure drop, flooding log p log (gas loading) flooding mG Different packings, systems log mL log (gas/liquid loading)
Flooding CY-Water CY- Toco Raschig-Water Raschig- Olive oil- Dist. EX-Water Stockfleth 1999 Billet-diagram
Flooding: Tocopherol Feed Mixture (55 % Toco) • Flooding diagram for tocopherol feed mixture (T155/CO2), Packing Sulzer CY ; Operating points (BP) and observed flooding points (FP). C. Saure, 1996
Density of Phases Densities of the coexisting phases of the system PFAD + CO2. N. Machado
Flooding: PFAD Hydraulic capacity diagram of packed columns. FV = f (y). N. Machado
Density of Phases • Density of coexisting phases: CO2–Squalene. • Flüssig-/Gasphase: /= 333,15 K, /= 353,15 K ▲/▲ = 373,15 K. D. Buß
Flooding: Squalene Hydraulic capacity diagram of packed columns: Squalene - CO2. N. Machado
Flooding: CPO Flooding Diagram, Crude Palm Oil - Carbon Dioxide, M. Jungfer, 2000
Flooding: Olive Oil Deodorizer Distillate • Flooding diagram CO2–OODD; Packing “Sulzer EX 35 mm”. Exp. Flooding Data: Stockfleth , o = Data of separation column. D. Buß, 2001.
Purification of Synthetic Tocopherolacetate • Loading limits for a 35 and 50 mm column. CO2. U. Fleck.
Pressure Drop Pressure-drop curves. M. Budich. Orange peel oil.
Flooding: Orange Peel Oil velocity of vapor phase inside an empty tube Overall correlation of flooding lines for CO2+orange peel oil. M. Budich
Flooding: Orange Peel Oil Median lines: B=52.7 for CO2+terpenes; B=77.5 for CO2+5-fold concentrate. A = 8.0. Comparison of flooding behavior of different mixtures. M. Budich.
Density of Phases Densities of coexisting phases of CO2+ethanol+water mixtures. M. Budich.
Flooding point data for CO2+ethanol+water M. Budich, 1999
Flooding: Ethanol - Water - CO2 Flooding point of CO2+ ethanol + water. M Budich.
Capacity of Columns Flooding point 100 000 kgCO2/(m2h): Column diameter Throughput [mm] [kgCO2/h] 25 49 50 196 100 785 Linear velocity: 46 mm/s