Download
1 / 53
530 likes | 790 Views
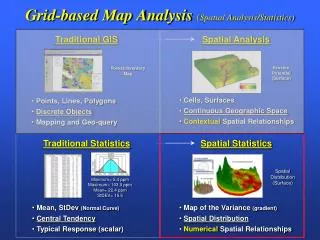
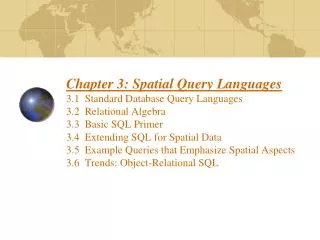
Extending ArcView’s Spatial Analysis Capabilities. Phil Hurvitz College of Forest Resources University of Washington April 7, 2003. Overview. Historical context of ESRI GIS spatial analysis tools Limitations of ArcInfo/AML Advantages of ArcView/Avenue

E N D
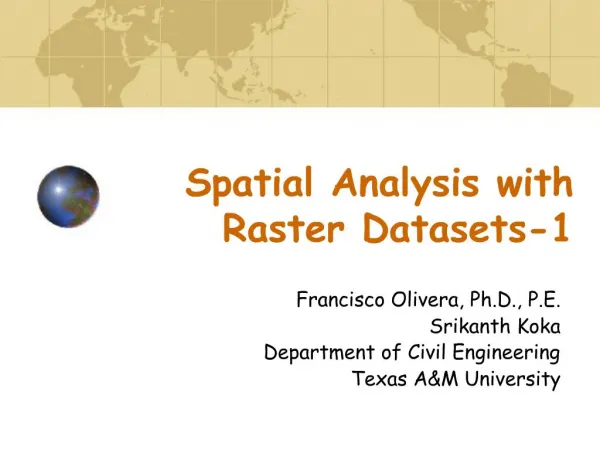
Extending ArcView’s Spatial Analysis Capabilities Phil HurvitzCollege of Forest ResourcesUniversity of Washington April 7, 2003
Overview • Historical context of ESRI GIS spatial analysis tools • Limitations of ArcInfo/AML • Advantages of ArcView/Avenue • Introducing 4 ArcView/Avenue based extensions for spatial analysis • Conclusion
Overview • Historical context of ESRI GIS spatial analysis tools • Limitations of ArcInfo/AML • Advantages of ArcView/Avenue • Introducing 4 ArcView/Avenue based extensions for spatial analysis • Conclusion
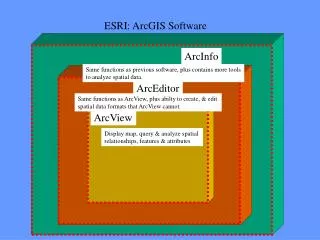
Historical context of ESRI GIS spatial analysis tools • ArcInfo has dominated the GIS market for years (20+ years) • New software tools have become available more recently • More functionality in a more user-friendly environment • ArcView (version 1.0, 1993?) • ArcGIS (version 8.0, 1999?)
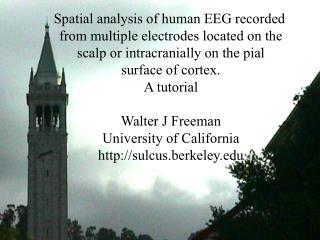
ArcInfo interface ArcViewinterface ArcGIS interface Historical context of ESRI GIS spatial analysis tools
Overview • Historical context of ESRI GIS spatial analysis tools • Limitations of ArcInfo/AML • Advantages of ArcView/Avenue • Introducing 4 ArcView/Avenue based extensions for spatial analysis • Conclusion
Limitations of ArcInfo/AML • ArcInfo is a very robust environment for spatial analysis • AML (Arc Macro Language) provides a programming environment for automating functionality • AML is a procedural language-based (macro) API for development of applications • + As users become better at the command line, their programming/command skills will increase • – If users do not start programming, their programming/procedure skills will never increase beyond a very basic level • – Procedural languages are not compiled, so their programs run slowly
Limitations of ArcInfo/AML (continued) • – AML is “clunky” • Basic dialogs do not exist • File saving, file writing, feature/record selections, graphical symbol definition • File locations are difficult to handle • Hard-coded pathnames are easier to program • Hard-coded pathnames reduce flexibility • – AMLs are completely file-based • AMLs exist as separate files that must be managed • Files can get corrupted, incorrectly altered, or lost without proper management • Inter-application macros must refer to specific AML files/pathnames
Limitations of ArcInfo/AML (continued) • – Because ArcInfo has no GUI, associating scripts with buttons or menus requires ArcTools programming • – ArcTools provides an API for creating GUIs • The ArcTools API is very difficult to code • ArcTools still runs on an AML back-end, which is slow
Overview • Historical context of ESRI GIS spatial analysis tools • Limitations of ArcInfo/AML • Advantages of ArcView/Avenue • Introducing 4 ArcView/Avenue based extensions for spatial analysis • Conclusion
Advantages of ArcView/Avenue • ArcView provides a new API: Avenue programming language with several major advantages (and a few drawbacks) • – ArcView runs in native mode with no command line • API needs to be learned as an entire new environment • + Avenue is compiled code rather than procedural • Runs much faster
Advantages of ArcView/Avenue, continued • + Scripts can be easily associated with menus, buttons, and tools in the GUI • + Not file-based • Scripts are typically created & stored in projects rather than as stand-alone files • Scripts can be packaged in “Extensions,” which provide complete application functionality as simple add-ins • Extension is a single OS file containing all necessary scripts & GUI controls
Overview • Historical context of ESRI GIS spatial analysis tools • Limitations of ArcInfo/AML • Advantages of ArcView/Avenue • Introducing 4 ArcView/Avenue based extensions for spatial analysis • Conclusion
Introducing 4 ArcView/Avenue based extensions for spatial analysis • LineSlope Analyst • LMS Analyst • FocalPatch Analyst • WBC Analyst
Introducing 4 ArcView/Avenue based extensions for spatial analysis • LineSlope Analyst • LMS Analyst • FocalPatch Analyst • WBC Analyst
205 ft 200 ft 30 ft LineSlope Analyst • Stream or road gradient is an important metric in hydrology & forest engineering • Gradient is easily calculated on a segment-by-segment or line-by-line basis slope % = rise / run * 100% (205 – 200) / 30 * 100% = 16.7%
LineSlope Analyst • Although gradient is easily calculated on a segment-by-segment or stream-by-stream basis, it takes programming to calculate gradient for an entire stream data set.
LineSlope Analyst • LineSlope Analyst Extension adds a single button to calculate gradient for any linear feature
Introducing 4 ArcView/Avenue based extensions for spatial analysis • LineSlope Analyst • LMS Analyst • FocalPatch Analyst • WBC Analyst
LMS Analyst • The Landscape Management System (LMS) is an integrated forest growth model, visualization, and analysis application • Incorporates GIS data in several modules • EnVision or SVS visualization module • Tree list expansion factors (rely on stand area) • Growth models (require stand-level topographic characteristics)
LMS Analyst • Stand topographic metrics are needed for growth models • Mean elevation per stand • Mean slope per stand • Mean aspect per stand • USGS or LiDAR based DEMs can be used to calculate these metrics
LMS Analyst: Mean Elevation • Mean elevation is a simple calculation
LMS Analyst: Mean Slope • Mean slope is a simple calculation
359º 1º 180 º LMS Analyst: Mean Aspect • Mean aspect is nota simple calculation • 359º = nearly due north • 1º = nearly due north • ( 359º + 1º ) / 2 = 180º • Nearly due south! • Must convert values to radian measures and use a more complicated calculation • Algebraic & trigonometric functions are available in ArcView
custom calculation LMS Analyst: Mean Aspect • Mean aspect is not is a simple calculation
LMS Analyst: Multiple nested buffers • Forests & Fish rules require multiple nested riparian buffers • ArcView includes a simple buffer method • Single buffers • Nested buffers, but only at equal-width • Nested buffers required by F&F are not equal-width • LMS Analyst MultiBuffer creates multiple nested buffers at users’ definition
Introducing 4 ArcView/Avenue based extensions for spatial analysis • LineSlope Analyst • LMS Analyst • FocalPatch Analyst • WBC Analyst
FocalPatch Analyst • FRAGSTATS is commonly used to calculate spatial metrics for landscapes, patches, or classes • FRAGSTATS as originally written calculates metrics only for the entire landscape or for entire or specific patches • What are the landscape characteristics in a neighborhood around a specific location? • How do neighborhood landscape characteristics change across large landscapes?
(image from Fragstats manual) Fragstats • Patch metrics
(image from Fragstats manual) Fragstats • Class metrics
(image from Fragstats manual) Fragstats • Landscape metrics
Focal Functions in GIS • Processing occurs on a central cell in conjunction with the values associated in its neighborhood • “Moving window” • “Kernel”
FocalPatch Analyst • On a cell-by-cell basis • Creates a point feature at the cell center • Extracts the region in a user-specified radius around the point • Calculates landscape metrics for that circle • Places metrics back into point attribute table • Point data can be interpolated to create different surfaces of each different focal landscape metric
FocalPatch Analyst • Extracts circular region from land cover grid at user-defined radius
Rempel’s batch script Rempel’sinterface FocalPatch Analyst • Calculates landscape metrics
FocalPatch Analyst • Calculateslandscape metrics • Values represent the landscape metrics for the circular focal region around the central cell
Patch Metrics and Utilization Distributions • Some animal species respond to large regions of landscapes • Typical animal-landscape relationships are analyzed either by point processes or by land cover types • Is there a relationship between local (focal) landscape metrics and actual animal usage of landscape? • To which landscape characteristics do animals respond?
utilization distribution (UD) limit processing to UD Patch Metrics and Utilization Distributions
utilization distribution contrast-weighted edge surface Patch Metrics and Utilization Distributions
Patch Metrics and Utilization Distributions • Regression techniques are used to determine strength of relationship between utilization and landscape metrics • Multiple regression • Raster regression within GRID • Process described in paper submitted to Ecology (Marzluff et al., 2003)
Introducing 4 ArcView/Avenue based extensions for spatial analysis • LineSlope Analyst • LMS Analyst • FocalPatch Analyst • WBC Analyst
WBC Analyst • Do patterns of urban environmental structure have an effect on exercise? • Are particular urban settings more conducive to exercise? • “Walk Friendly” • “Bike Friendly” • Urban structure must be quantified before answering these questions • GIS provides the tools for quantifying the composition and configuration of urban structure
WBC Analyst • Performs tasks that would be either impossible or extremely time-consuming manually • Analysis based on proximity to selected households • Based on Euclidean and network buffers, network connectivity
WBC Analyst • Tallies land uses within user-specified distance of households • Finds closest of each land use type, by Euclidean and network distance
WBC Analyst • Creates convex hull “neighborhood clusters” of key urban land uses (e.g., grocery & retail stores) • Clusters are defined by particular land uses and numbers of parcels within a specific proximity
WBC Analyst • Tallies land uses within neighborhood clusters • Determines Euclidean and network distances to each household’s closest neighborhood cluster
WBC Analyst • Telephone survey has obtained personal exercise habits for 750 households in King Co. • WBC Analyst creates output tables to be used for statistical analysis with telephone survey results • If there is a relationship between urban structure and habits, it will be possible to predict the “walkability” and “bikeability” of neighborhoods based solely on readily available GIS data. • CDC funding for initial project