Download
1 / 35
370 likes | 393 Views
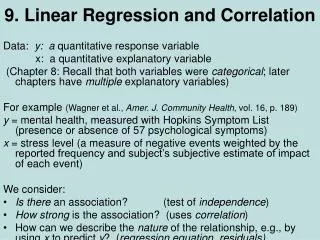
Linear Regression and Correlation. Chapter 13. GOALS. Understand and interpret the terms dependent and independent variable. Calculate and interpret the coefficient of correlation, the coefficient of determination, and the standard error of estimate.

E N D
Linear Regression and Correlation Chapter 13
GOALS • Understand and interpret the terms dependent and independent variable. • Calculate and interpret the coefficient of correlation, the coefficient of determination, and the standard error of estimate. • Conduct a test of hypothesis to determine whether the coefficient of correlation in the population is zero. • Calculate the least squares regression line. • Construct and interpret confidence and prediction intervals for the dependent variable.
Regression Analysis - Introduction • Recall in Chapter 4 the idea of showing the relationship between two variables with a scatter diagram was introduced. • In that case we showed that, as the age of the buyer increased, the amount spent for the vehicle also increased. • In this chapter we carry this idea further. Numerical measures to express the strength of relationship between two variables are developed. • In addition, an equation is used to express the relationship. between variables, allowing us to estimate one variable on the basis of another.
Regression Analysis - Uses Some examples. • Is there a relationship between the amount Healthtex spends per month on advertising and its sales in the month? • Can we base an estimate of the cost to heat a home in January on the number of square feet in the home? • Is there a relationship between the miles per gallon achieved by large pickup trucks and the size of the engine? • Is there a relationship between the number of hours that students studied for an exam and the score earned?
Correlation Analysis • Correlation Analysisis the study of the relationship between variables. It is also defined as group of techniques to measure the association between two variables. • A Scatter Diagramis a chart that portrays the relationship between the two variables. It is the usual first step in correlations analysis • The Dependent Variable is the variable being predicted or estimated. • The Independent Variable provides the basis for estimation. It is the predictor variable.
Regression Example The sales manager of Copier Sales of America, which has a large sales force throughout the United States and Canada, wants to determine whether there is a relationship between the number of sales calls made in a month and the number of copiers sold that month. The manager selects a random sample of 10 representatives and determines the number of sales calls each representative made last month and the number of copiers sold.
The Coefficient of Correlation, r The Coefficient of Correlation (r) is a measure of the strength of the relationship between two variables. It requires interval or ratio-scaled data. • It can range from -1.00 to 1.00. • Values of -1.00 or 1.00 indicate perfect and strong correlation. • Values close to 0.0 indicate weak correlation. • Negative values indicate an inverse relationship and positive values indicate a direct relationship.
Coefficient of Determination The coefficient of determination (r2) is the proportion of the total variation in the dependent variable (Y) that is explained or accounted for by the variation in the independent variable (X). It is the square of the coefficient of correlation. • It ranges from 0 to 1. • It does not give any information on the direction of the relationship between the variables.
Correlation Coefficient - Example Using the Copier Sales of America data which a scatterplot was developed earlier, compute the correlation coefficient and coefficient of determination.
Correlation Coefficient - Example How do we interpret a correlation of 0.759? First, it is positive, so we see there is a direct relationship between the number of sales calls and the number of copiers sold. The value of 0.759 is fairly close to 1.00, so we conclude that the association is strong. However, does this mean that more sales calls cause more sales? No, we have not demonstrated cause and effect here, only that the two variables—sales calls and copiers sold—are related.
Coefficient of Determination (r2) - Example • The coefficient of determination, r2 ,is 0.576, found by (0.759)2 • This is a proportion or a percent; we can say that 57.6 percent of the variation in the number of copiers sold is explained, or accounted for, by the variation in the number of sales calls.
Testing the Significance ofthe Correlation Coefficient H0: = 0 (the correlation in the population is 0) H1: ≠ 0 (the correlation in the population is not 0) Reject H0 if: t > t/2,n-2 or t < -t/2,n-2
Testing the Significance ofthe Correlation Coefficient - Example H0: = 0 (the correlation in the population is 0) H1: ≠ 0 (the correlation in the population is not 0) Reject H0 if: t > t/2,n-2 or t < -t/2,n-2 t > t0.025,8 or t < -t0.025,8 t > 2.306 or t < -2.306
Testing the Significance ofthe Correlation Coefficient - Example The computed t (3.297) is within the rejection region, therefore, we will reject H0. This means the correlation in the population is not zero. From a practical standpoint, it indicates to the sales manager that there is correlation with respect to the number of sales calls made and the number of copiers sold in the population of salespeople.
Regression Analysis In regression analysis we use the independent variable (X) to estimate the dependent variable (Y). • The relationship between the variables is linear. • Both variables must be at least interval scale. • The least squares criterion is used to determine the equation.
Regression Analysis – Least Squares Principle • The least squares principle is used to obtain a and b. • The ALTERNATIVE equations (we will not use these) to determine a and b are:
Regression Equation - Example Recall the example involving Copier Sales of America. The sales manager gathered information on the number of sales calls made and the number of copiers sold for a random sample of 10 sales representatives. Use the least squares method to determine a linear equation to express the relationship between the two variables. What is the expected number of copiers sold by a representative who made 20 calls?
Computing the Estimates of Y Step 1 – Using the regression equation, substitute the value of each X to solve for the estimated sales
The Standard Error of Estimate • The standard error of estimate measures the scatter, or dispersion, of the observed values around the line of regression • The formulas that are used to compute the standard error:
Standard Error of the Estimate - Example Recall the example involving Copier Sales of America. The sales manager determined the least squares regression equation is given below. Determine the standard error of estimate as a measure of how well the values fit the regression line.
Graphical Illustration of the Differences between Actual Y – Estimated Y
Assumptions Underlying Linear Regression For each value of X, there is a group of Y values, and these • Y values are normally distributed. The means of these normal distributions of Y values all lie on the straight line of regression. • The standard deviations of these normal distributions are equal. • The Y values are statistically independent. This means that in the selection of a sample, the Y values chosen for a particular X value do not depend on the Y values for any other X values.