Download
1 / 20
200 likes | 265 Views
IBM SmartCloud Monitoring Capacity Planner PowerVM Placement – TOPOLOGY VIEW Girish B Chandrasekhar. As a end user of the Capacity Planner I wanted to see some good graphical user interface which help me visualize my environment and analyze the LPARS of placement….

E N D
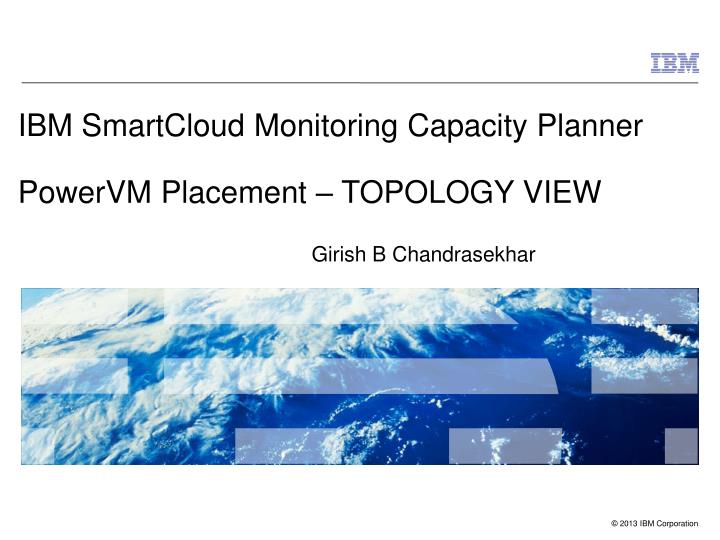
IBM SmartCloud Monitoring Capacity PlannerPowerVM Placement – TOPOLOGY VIEW Girish B Chandrasekhar
As a end user of the Capacity Planner I wanted to see some good graphical user interface which help me visualize my environment and analyze the LPARS of placement… Sure, we are trying to improve Capacity Planner user interface. For the power placement we have introduced ‘TOPOLOGY VIEW’ which provide the better GUI experience When Capacity Planner does the LPARS placement, it suggests optimized way to place the LPARS based on their utilization and system capacity. How does it sounds to you if we show your current environment details, Capacity planner suggested environment and LPAR movement details in one place… don’t you want some thing like that? ‘Topology view’ for power placement, sounds interesting…. Can you tell me more about the same….
Hmmm…. It all sounds interesting.. But I don’t believe it unless I see it myself… Let me explain more about the ‘Topology view’ we have introduced for Power Placement. Let us say, using the Capacity Planner you run the placement algorithm and it does the suggestion of LPAR sizing and optimized placement ‘Topology View’ shows your Physical Server, with in which you see two groupings. ‘CURRENT Topology’ and ‘SUGGESTED Topology’. Current topology will have all the LPAR details of your current environment. As you will guess ‘SUGGESTED topology’ shows all the LPARs Capacity planner suggested after optimization and applying the rules.. I hope you know that you have apply your own rules during optimization.. Take a look at Topology view for placement.. Ok… now how does ‘topology view’ visually represents optimized environment suggestion?
I see lot of boxes… Can you explain more what do they represent? If my environment has hundreds of LPARS will Topology view handle it? How can I see all those LPARS.. Wouldn’t they become very small to see what they are Let me explain more about what you are calling ‘boxes’.. Each box represents a LPAR. Topology view has zoom in and zoom out facility… so if you have hundreds of LPARS you can still see all of them and you can further zoom in to view more closely Let me explain to you what each colored ‘boxes’ represents.. I will also show by zooming in further Hmmm… what are those big grey boxes.. What are those yellow, green and red boxes?
HMC managing Physical Sever Physical server LPARS Group SUGGESTED Topology Group NOT PLACED LPAR Group Dedicated CPU Group EXISTING Topology Group User Define CPU Pool Group VIOS Group Default CPU Pool Group
To search item Your position in the Topology view when Zoomed in Zoom In Zoom Out Fit to window Discovered AIX LPAR AIX LPAR Fictitious AIX LPAR Discovered LINUX LPAR
Ah ha… so now I am seeing some usefulness of Topology view.. So Grey boxes represents Physical Servers and with in which Existing/Suggested Topology. With in which it furthers groups as LPARS and VIOS. With in each LPARS group, its further groups as Dedicated, Default Pool and User Defined pool LPARS. You are right! Doesn’t it grouping helps you visualize your environment better? Right!! Did you also observe if during the analysis, if some LPARS are not able to be placed, especially when colocation/anti colocation rules are applied, those not placed LPARS are grouped separately on top near HMC. They are represented with red background I assume you represent Existing LPAR with yellow background and Suggested LPAR with green background So Fictitious LPARS are represented with ‘?’ mark to differentiate That is correct. User creates the Fictitious LPAR to do ‘WHAT-IF’ analysis and its represented with ‘?’ mark. LPARS without ‘?’ are discovered one which are loaded via ‘load configuration’.
Now I can see Physical servers and LPARS. Is there a way I can see details about them? Yes. Just double click on the item whose details you want to see Or you can also right-click and select ‘properties’ menu. It will show you properties dialog Correct!!.. For physical server it shows model details, activated cores, memory available etc. For LPARS it shows Entitlement, Memory assigned, OS details etc. For LPARS it also shows the utilization details So if I double click on Physical Server, it will show the details of the physical server and if I do the same on LPARs it shows the details of the LPAR If you just the bring mouse over each of the node, it shows ‘mini’ details….
Physical Server Properties LPAR Properties LPAR Details Model Details Utilization Details SUGGESTED Topology Group Properties Summary of the group
Oh yes.. Each colored arrow has specific meaning. Just by looking at it you can visualize what happed to LPAR during the placement I see lot of colored arrows in each LPAR. Do they represent some thing? At the bottom of the view you see list of arrow which represents the ‘status’ of the LPAR. Black background for Discovered LPAR and grey background for Fictitious LPAR Blue Arrow – LPAR PLACED on same Server Green Arrow – LPAR PLACED on different Server red Arrow – LPAR NOT PLACED NO LPARs on CURRENT Topology – New server with No LPARs yellow Arrow – VIOS created during placement NO LPARs on SUGGESTED Topology – Server ready for ‘RETIREMENT’ current suggested No LPARS Discovered Fictitious
Current Discovered LPAR moved to same Server (not moved LPAR) Current Fictitious LPAR moved to different Server Suggested Discovered LPAR moved in from same Server Current Discovered LPAR moved to different Server (moved LPAR) Suggested Discovered LPAR moved in from different Server Current Discovered LPAR NOT PLACED
Is there a search facility? If I have too many LPAR and I want to look for specific LPAR, is it possible? I understand your concern. If there are hundreds of LPAR how to locate a specific LPAR. You can achieve it by using the search facility If I want to see only LPARS that are moved to different server.. Is it possible You can click on ‘Search’ button on top, that will open search dialog. You can search based on the Physical server name or LPAR name Yes. That is also possible to selecting the status icon at the bottom
Start typing the item you want to search, filtering of data happens Clears the search and highlights all the items back to original position Centers the selected item in the topology view Highlights the selected item in the view by blurring rest of the items
HA2 item selected is highlighted. Click Search->’Clear Search’ to clear the search
Click on ‘Current Discovered’ icon. All the ‘Current Discovered’ nodes get highlighted You can also select multiple icon. Its highlights all of the selected ones. You can also see the Filtered item count
Yes… you can do that also!! All you have to do is right click on the node. You will see the context menu. Select which ever you want. If I have so many LPARs and many physical servers. If during the placement if the LPAR is moved to different server is there a way I can see which server it went to? Or if there is a LPAR in Suggested topology can I see from which server that LPAR came from Shows a arrow to the VIOS which this LPAR uses for I/O hides arrow to the VIOS which this LPAR uses for I/O if already shown Shows a arrow to the LPAR from/to which this LPAR moved to/ came from hides arrow to the LPAR from/to which this LPAR moved to/ came from if already displayed
Solid arrow showing which VIOS the current LPAR uses for I/O Dotted arrow showing from which server to which server the LPAR is moved during the placement
I feel these LPAR movement representation help me analyze the placement suggested by Capacity planner… I feel this is very powerful capability You can also see all the movement once. Also note that you have save the topology as image or you can printout the same. DO ‘YOU’ ALSO FEEL TOPOLOGY VIEW REPRESENTATION ENHANCE THE USER VISUALIZATION EXPERIENCE FOR PLACEMENT? PLEASE DO LET US KNOW……… THANK YOU!!