Download
1 / 22
220 likes | 350 Views
Ricardo Eusebi Fermi National Accelerator Laboratory. Operation of the CDF Silicon Detector. 10 th INTERNATIONAL CONFERENCE ON INSTRUMENTATION FOR COLLIDING BEAM PHYSICS Budker Institute of Nuclear Physics, Siberian Branch of Russian Academy of Science, Novosibirsk, Russia

E N D
Ricardo Eusebi Fermi National Accelerator Laboratory Operation of the CDF Silicon Detector 10th INTERNATIONAL CONFERENCE ON INSTRUMENTATION FOR COLLIDING BEAM PHYSICS Budker Institute of Nuclear Physics,Siberian Branch of Russian Academy of Science,Novosibirsk, Russia February 28 - March 5, 2008
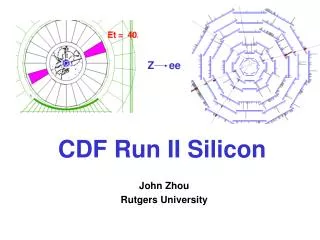
Silicon Detectors at CDF • At the core of the CDF detector • Largest operating silicon detector • 7-8 concentric layers of silicon • 7 m2 of silicon with 1.2 cm < r < 32 cm • 722,432 cha., 5644 chips, 704 sensors • Designed only for Run IIa (~2/3fb-1) • Upgrade for Run IIb was cancelled! Silicon will have to survive through Run IIb (6/8 fb-1) Ricardo Eusebi - INSTR 08, Novosibirsk, Russia
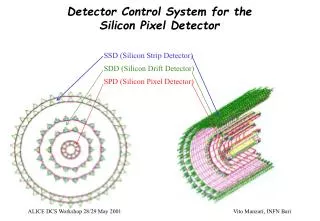
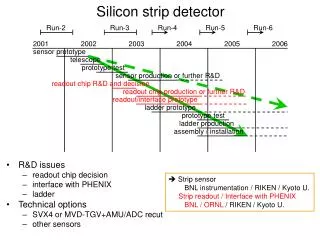
Silicon Sub-detectors • Three Sub-detectors • SVX II: 5 double sided layers • Intermediate Silicon Layers (ISL): 3 double sided layers • Layer 00 (L00): Single sided, LHC-style sensors Ricardo Eusebi - INSTR 08, Novosibirsk, Russia
Sub-detector: SVX II • SVX II: The core of the silicon systems • Overall dimensions: • 1 meter along beam direction • Radii from 2.5 to 10.6 cm • Structure: three identical barrels • 2 bulkheads • 12 wedges • 5 concentric silicon layers • Silicon layers • Strip pitch: 60 to 140 mm • Layers 0,1 and 3(Axial and 90º strips) • Layers 2 and 4(axial and 1.2º strips) SVX II before installation SVX II barrel Ricardo Eusebi - INSTR 08, Novosibirsk, Russia
Sub-detector: L00 • Layer 00: Right onto the beam pipe • Overall dimensions: • 1 meter along beam direction • Radii from 1.2 to 2.1 cm • Structure: one single layer • 2 bulkheads • Three consecutive sensors • 6 wedges • Silicon layers • Strip pitch: 25 mm • Axial strips • Radiation tolerant (LHC style) L00 during installation 1.2 cm 2.1 cm Ricardo Eusebi - INSTR 08, Novosibirsk, Russia
Sub-detector: ISL • ISL: Intermediate Silicon Layers • Overall dimensions: • 1.9 m along beam direction • Radii from 20.5 to 29 cm • Structure: three different barrels • Central: Single layer,14 wedges • Forward:Two layers,12 and 18 wedges • Each barrel two bulkheads • Silicon layers • Strip pitch: 55 mm • Axial and 1.2º strips ISL sensors Ricardo Eusebi - INSTR 08, Novosibirsk, Russia
Operational Issues During commissioning: • Blocked Cooling lines • Blocked by glue, well inside the detector • Solution: open them up with a powerful laser • Resonances • Wire bonds to the magnetic field • Synch. Readout wire oscillate and break • Solution: Stop high frequency synchronous readouts. • Beam Incidents • High dose accidentally delivered to the detector • Solution: • Collimators in key parts of the Tevatron • New Diamond based BLM system. After commissioning: Infrastructure & Aging B Jumper groove left by beam Ricardo Eusebi - INSTR 08, Novosibirsk, Russia
Infrastructure & Aging: Power Supplies • Common failure modes of CAEN SY527 • Communication loss • Corrupted read back of voltages/currents • Spontaneous switch off • Failure mode of power supply modules: • Voltages in Analog, Digital and Port-Card supply start slowly dropping. • Up to 47 Power supplies started to show this. • Problem: • aging of one type of capacitor • 36 capacitors per power supply • Can result in bit errors • Solution: • Wait for the shutdown of September 2007 and … • take all faulty power supplies out • replace all 36 capacitors (on FNAL site) • put them back in and test them on location. • Time intensive effort, lasted about 2 months. • Not enough time to change all • Still expect to replace others as failure appears All power supplies with this failure were replaced! Ricardo Eusebi - INSTR 08, Novosibirsk, Russia
Infrastructure & Aging: Cooling Lines • Cooling Lines • Symptoms: electronic-valves start failing. • Problem: ISL cooling line (10% glycol in water) became ACIDIC (ph=2) during the 2006 shutdown • Solution: coolant neutralized by draining and larger use of de-ionizing resin bed Ion chromatography analysis showed carboxylic acids, mostly formic acid. Likely came from the oxidation of glycol • Welds of the aluminum rings that cool optical transmitter had already been corroded • One meter from the closest accessible point • Why there ? • Corrosion-resistance: is alloy-dependent • Heat affected zone around junctionsmanifold most sensitive (alloy: 6061-Al). Ricardo Eusebi - INSTR 08, Novosibirsk, Russia
Infrastructure & Aging: Cooling Lines Repair • Started shutdown of 2007: • Keep the silicon cold and dry at all times • A plastic tent was setup to work. • A custom made air dryer changed the volume every 2 minutes. • Dew Point was always kept below -10 Cº. • Basic Idea: • Cover holes with epoxy from the inside of the pipe • using borescopes and catheters. • Repairs took a month • 4 shifts of people • Current tests: • Tight vacuum in the repaired lines Hole Repaired cooling system has been running stable for months ! Ricardo Eusebi - INSTR 08, Novosibirsk, Russia
Environmental Effects on Silicon Sensors • Radiation effects: • Modifies the crystal structure of the sensor bulk. • Intrinsic parameters change with time. • P-N junction evolves, and eventually disappears with time. • Annealing effects: • Due to temperature change of the sensors. • Defects created by radiation are strongly affected. • Performance of the sensor degrading with time: AGING • Depletion voltage increases with time. • Sensor has a maximum breakdown voltage. • Can we fully deplete the sensor until the last day of operation ? • Signal decreases with time and noise increases with time • Can we keep good signal and noise levels until the last day of operation ? Ricardo Eusebi - INSTR 08, Novosibirsk, Russia
Radiation Field • Measured using more than 1000 thermo-luminescent dosimeters (TLDs) • Two different data-taking periods allowed for distinction between fields: • Radiation field is collision-dominated and scales with due to beam losses due to pp collisions p p (See R. J. Tesarek et al., IEEE NSS 2003) How this field affects the silicon sensors ? Ricardo Eusebi - INSTR 08, Novosibirsk, Russia
Depletion Voltage: Signal Vs Bias • Look at the charge collection distribution • Reconstruct a track w/o using the studied sensor • If track points to hit in sensor record its charge • Charge collection distribution • Follows a landau distribution • Distribution is smeared by intrinsic noise • Fit the curve to a Landau convoluted by Gaussian(4 parameter fit) • Depletion Voltage: • Maximal for a fully depleted sensor • Study charge collection as function of VBIAS • Identify charge of Most Probably Value (MPV)in each distribution Ricardo Eusebi - INSTR 08, Novosibirsk, Russia
Depletion Voltage: Signal Vs. Bias • Plot charge’s Most Probable Value for different bias voltages • Fit to a sigmoid (parameters include the plateau of maximum charge) • Define depletion voltage Vd • Our criteria: voltage that collects 95% of the charge at the plateau • Depletion Voltage as a function of luminosity • 3rd order polynomial fit around the inversion point • Linear fit to extrapolate to the future Ricardo Eusebi - INSTR 08, Novosibirsk, Russia
Depletion Voltage: Noise Vs Bias • Take advantage of double sided sensors, that have strips on the back side • Depletion zone grows from the p+ side • Noise on the other side’s strips (n+) reduce when the depletion zone reaches them. • Need a criteria for defining Vd • We use 95% reduction in noise between the two plateaus • No beam required • no interference with data-taking • Does not work after the sensor underwent inversion. • Depletion zone generated differently Ricardo Eusebi - INSTR 08, Novosibirsk, Russia
Depletion Voltage: Results • Prediction for L00 • Depends on type of sensor • Oxygenated ladders invert much later • Prediction for SVX-L0 We should be able to deplete sensors until the end of Run II Ricardo Eusebi - INSTR 08, Novosibirsk, Russia
Signal to Noise Ratio • The figure of merit of the performance is the Signal to Noise Ratio (S/N) • Signal: charge collected when a charged particle crossed the sensor • Noise: intrinsic noise of the detector • Signal • Use J/y m+m- tracks • Get total charge of cluster • Decrease linearly with Lum. • Mean Strip Noise • Average over strips in charge cluster • Obtained from calibrations taken every two week. • Square root increase with Lum. Ricardo Eusebi - INSTR 08, Novosibirsk, Russia
Signal to Noise Ratio • Fit of S/N • Limit I: S/N=8 (SVT eff.) • S/N = 6, ~5% loss in SVT eff. • Limit II: S/N=3 (B tag eff.) • Sensor-type behavior • Layers 2,4 (Micron) • Layers 0,1,3 (Hamamatsu) • First layer • careful monitoring to see if it is going to be useful at 4/5 fb-1. Most of the silicon layers will be fully operational until the end of Run II Ricardo Eusebi - INSTR 08, Novosibirsk, Russia
Conclusions • Operational Issues: • Advice : expect the unexpected. • We have recovered cooling to the full detector subsystems. • Power supply modules with unstable voltages fixed at FNAL • Sensor Aging • Data indicates that we will be able to fully deplete the sensors • The innermost layers of the detector have passed type inversion • Studies indicate we will remain with a very effective S/N ratio. The CDF Run II Silicon Detector will continue successful operation for the rest of Run II !! Ricardo Eusebi - INSTR 08, Novosibirsk, Russia
Radiation Effects on Silicon Sensor • Bias current increases with integrated radiation • Theory: • Can be used to obtain flux • Comparison with TLD’s prediction fluence sensor’s volume damage factor (See R. J. Tesarek et al., IEEE NSS 2003) Ricardo Eusebi - INSTR 08, Novosibirsk, Russia
Fermilab and the Tevatron • Fermilab (1967) • Large number of H.E.P. projects • Tevatron Run II (2001–2009) • Proton-antiproton collider • Two multi-purpose detectors • CDF & DØ Fermi National Accelerator Laboratory – Aerial View Tevatron 2 km [Fermilab Visual Media Service] • Proton-antiproton collider • √s = 1.96 TeV, 36×36 bunches • Record instant. peak luminosity292 µb–1 s–1(1 µb–1 s–1 10–30 cm–2 s–1) • Expect 6–8 fb–1 by end of Run II Ricardo Eusebi - INSTR 08, Novosibirsk, Russia