Download
1 / 10
100 likes | 222 Views
The Standard Normal. Unit 5, Day 3. Learning Goals for Today. I can state the difference between a Normal Distribution and a Standard Normal Distribution. I can use a z-score table to determine percentiles. I can solve problems using standardization to solve Normal Distribution problems.

E N D
The Standard Normal Unit 5, Day 3
Learning Goals for Today • I can state the difference between a Normal Distribution and a Standard Normal Distribution. • I can use a z-score table to determine percentiles. • I can solve problems using standardization to solve Normal Distribution problems.
The Normal Distribution… limits Up to this point, we can only determine the percent of data that lies under a Normal Distribution based on how many standard deviations we are away from the mean. Is it possible to find the percentage of data for any given value? To answer this question, we need to study the Standard Normal Distribution.
The Standard Normal Distribution • The standard normal distribution is a special distribution with a mean of 0 and standard deviation of 1. So, Z~N(0,1).
In addition… • Approximately 68% of the data lies within one standard deviation of the mean. • Approximately 95% of the data lies within two standard deviations of the mean. • Approximately 99.7% of the data lies within three standard deviations of the mean. • The area under the curve is 1 (comes from Calculus). Thus, the percentage of data that lies between two values, a&b, is the area under them. • These are the six properties of the normal distribution.
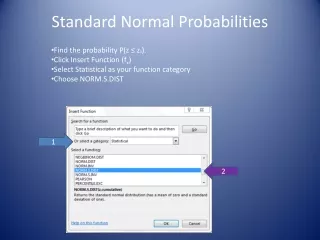
Okay, and what’s so special about that? Statisticians have calculated the area under the standard normal distribution for any given value z value. The result is the Z-Score Table. This is a table of percentages for any value under the standard normal. This allows us to determine ANY number of standard deviations from the mean and look up it’s associated probability.
Recap of what we know about a z-score We did z-scores already, and learned that they told us a specific number of standard deviations away from the mean any particular data value is. We know that any data value can be written as: Now, solve for z:
Example #1 Given X~N(14, 42), determine the number of standard deviations each data piece is from the mean. a) x =10b) x=23.5
Example #2 Perch in a lake have a mean length of 20 cm and a standard deviation of 5 cm. Find the percent of the population that is • less than 22 cm, • greater than 28 cm • between 16 and 28 cm.
Homework Page 186 #1, 3, 4, 6 a,c,e, 7, 11