Download
1 / 32
320 likes | 328 Views
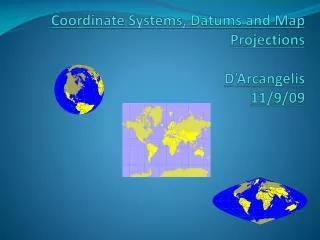
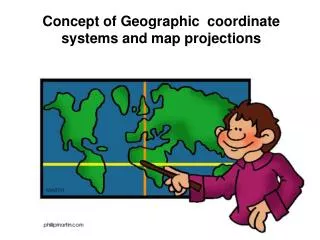
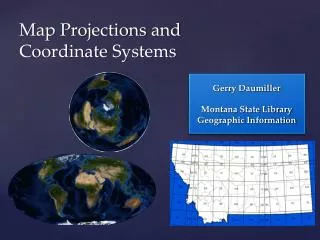
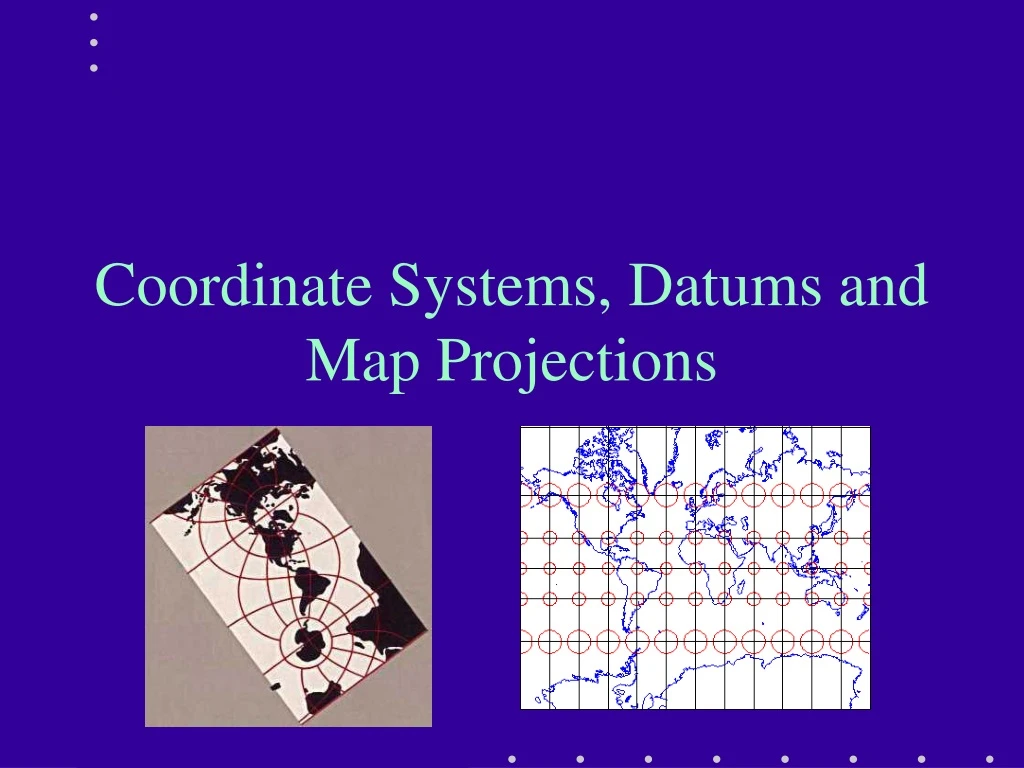
Coordinate Systems, Datums and Map Projections. Geodesy. The study of the size and shape of the Earth. The Earth is…. 3000 BP Bablonians An oyster 600 BP Greeks Flat 500 BP a perfect shape A sphere 300 BP Circumference ~ 25,000 miles,

E N D
Geodesy The study of the size and shape of the Earth.
The Earth is… • 3000 BP Bablonians An oyster • 600 BP Greeks Flat • 500 BP a perfect shape A sphere • 300 BP Circumference ~ 25,000 miles, • Dark ages Flat again • 1492 Columbus A pear • 1753 French Oblate ellipsoid • Spheriod • Geoid to describe the deviations from a spheriod
Geographic Coordinate System • Parallels • Meridians • Great and Small Circles
Geographic Coordinate System GCS uses a 3-D spherical surface to define locations on Earth. GCS includes an angular unit of measure, a prime meridian and a datum.
Geographic Coordinate System • Longitude and Latitude • Degrees, minutes, seconds • 1o latitude = ~110.5 km (equator) • 1o longitude = cosine of the latitude • 1 minute of latitude = ~1852 meters
How to convert form DMS to DD • Example: 37°36’30” • Divide each value by the number of minutes or seconds in a degree • 36 minutes = .60 degrees (36/60) • 30 seconds = .00833 degree (30/3600) • Add it all up • 37° + .60 + .00833 = 37.60833 DD
Sphere vs. Speroid A sphere is okay for small scale maps (<1:5,000,000). For larger scale maps a spheroid is necessary, the spheroid used will depend upon the purpose, location, and accuracy of the data.
Datums • Reference frame for locating points on Earth’s surface • Defines origin & orientation of latitude/longitude lines • Defined by spheroid and spheroid’s position relative to Earth’s center.
N. American Datums • NAD27 • Clarke 1866 spheroid • Meades Ranch, KS • Local datum • NAD83 • GRS80 spheroid • Earth-centered datum • GPS-compatible • NAD27 NAD83 up to 500’ shift
Datums and Elevation • Horizontal and Vertical Datums • Sea - level? • Panama Canal • Height Above Ellipsoid (HAE) • Height Above Geoid (HAG)
A spherical planet in plane terms Projected coordinate systems are any coordinate system designed for a flat surface.
Map Projection • Distortions are inherent in maps • Earth is round, map is flat • Projectionis the term used to describe the process of mapping a round surface to flat paper 13
Projection & Datum Overview • Earth is three-dimensional • Map (screen) is 2-D • Projections convert 3-D to 2-D • 3-D to 2-D causes distortions • Datums locate in 3-D
Map Projections • Map projections always introduce distortion of some kind • Distance • Direction • Shape • Area
Map Projections, cont. • There are many kinds of projections for different parts of the world • Different projections produce different distortions • Key is choosing appropriate projection for a particular situation
Map Projections and GIS, cont. • Should be considered before starting to automate GIS data or starting a GIS project • Must also be considered if you obtain data from other sources (who doesn’t?) • Map projections are central to insuring different GIS databases properly register to one another (really important in GIS!) • Important for valid spatial analysis
The State Plane Coordinate System (SPCS) • Not a true map projection but rather a set of coordinate systems for every state. • Designed in the 1930s to provide a local reference system tied to a national datum. • Most USGS 7.5 minute maps indicate state plane coordinates (as well as UTM, and lat-long grid) • Some states (depending on size and latitudinal extent) have multiple zones
State Plane Zones for NAD 1983 1 2 3 4 5 6
The State Plane Coordinate System (SPCS), cont. • East-West oriented States use the Lambert Conformal Conic projection (ex. Tennesse) • North-South oriented States use the Transverse Mercator projection (ex. Illinois) • One zone in Alaska uses Oblique Mercator • Based on the North American Datums: NAD27 and NAD83 • Reference Eastings and Northings
UTMUniversal Transverse Mercator • Transverse Cylindrical (Mercator) Projection • 60 zones • 6o wide • Central meridian is 500,000 m • Eastings • 0 is 500,000m west of central meridian • Northing • depends on hemisphere and is measured in meters from the equator • We are in Zone 10 N
A Generic UTM Zone We are in UTM zone 10 north
Basic Feature of Maps • Scale can never be totally accurate all over the map, unless the map covers a very small area. • Features: Title, Date, Legend (key), North Arrow (magnetic vs. true north)
Map Characteristics • Scale • Ratio between distance on map to distance on Earth • Small scale - cover large area • e.g. 1 : 1,000,000 • Large scale - shows more detail • e.g. the 1 : 2,400 • Types: Representative fraction, linear, verbal • Resolution • accuracy that location and shape can be depicted • Diminishes with scale 10
Topographical vs. Thematic Maps • Topographical • Maps whose primary purpose is to indicate the general lay of the land • outline natural features • topographical maps often show other features such as roads, boundaries, rail links 5
Topographical vs Thematic Maps • Thematic Maps • displays geographic concepts • population density • climate • land use • etc. 6
Types of Thematic Maps • Chloropleth Maps • maps that display information using man-made reporting areas. Areas shaped according to their value. • census tracts, ZIP codes, counties, etc. • Area Class Maps • maps that display information by constant attribute • e.g. coniferous Vs deciduous forest 7
Types of Thematic Maps • Isopleth (Isoline) Maps • maps showing imaginary surfaces -connects all points with equal value. • contours • pressure • temperature • pollution levels • Isolines are: • drawn at regular intervals • never cross • they are closed lines • values inside are higher than outside 8