Download
1 / 20
210 likes | 337 Views
Cereal Nitrogen Use Efficiency in Sub Saharan Africa.

E N D
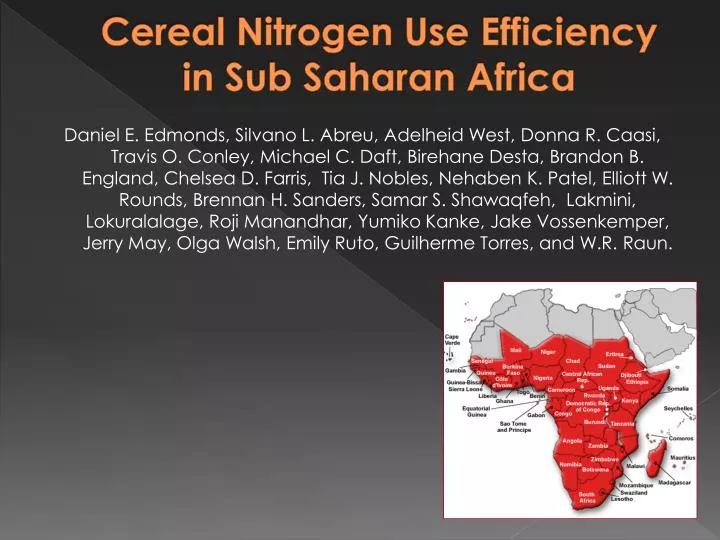
Cereal Nitrogen Use Efficiency in Sub Saharan Africa Daniel E. Edmonds, Silvano L. Abreu, Adelheid West, Donna R. Caasi, Travis O. Conley, Michael C. Daft, Birehane Desta, Brandon B. England, Chelsea D. Farris, Tia J. Nobles, Nehaben K. Patel, Elliott W. Rounds, Brennan H. Sanders, Samar S. Shawaqfeh, Lakmini, Lokuralalage, Roji Manandhar, Yumiko Kanke, Jake Vossenkemper, Jerry May, Olga Walsh, Emily Ruto, Guilherme Torres, and W.R. Raun.
Responsibility • “With great power comes great responsibility”Uncle Ben to Spider Man • “The Price of Greatness is Responsibility” Winston Churchill • "In a democratic world, as in a democratic Nation, power must be linked with responsibility... ." Franklin Delano Roosevelt • “Much will be required of the person entrusted with much and still more will be demanded of the person entrusted with more.” (Luke 12:48)
“Although the United States consistently ranks first or second in absolute amounts of foreign aid, it falls last among industrial countries when aid is measured as a percentage of GNP.” • http://www.usaid.gov/fani/ch06/objectives03.htm
Computing NUE • NUE = (Grain N uptake Fertilized – Grain N uptake non-fertilized)/N Rate applied • NUE Definitions
Sub-SaharanAfrica vs. USA SAA USA • Population, million 700 300 • Cereals, million ha 88 56 • Production, million tons 97 364 • Yield, tons/ha 1.1 6.5 • Fertilizer N, million tons 1.3 10.9 • Avg. N rate, kg/ha 4 52 • % of world N consumed 1.4 13 • % of world population 10 4
Nitrogen Use Efficiency • Malakoff (Science, 1998) • $750,000,000, excess N flowing down the Mississippi River • Africa expenditure on fertilizer N, cereals • $706,000,000 • Nitrogen Use Efficiency (NUE) World 33% • Developed, 42% • Developing, 29% • 20% increase • Worth $25.8 billion US annually
US Expenditures, Int. Aid • 27 Million Golfers in the USA24.3 Billion dollars spent on golf in 2004 ($888/person/year) • 82 Million Hunters USA (fishing, etc.)108 Billion spent on hunting in 2001 ($1317/person/year) • Americans and Europeans together spend $17 billion a year on pet food, $4 billion more than the estimated yearly additional amount needed to provide everyone in the world with basic health and nutrition.
Summary • Eereal production in SSA is inadequate for supporting the nutritional demands of a rapidly growing population. • Nutrient mining, particularly nitrogen (N), has taken place in virtually all areas where cereals are produced in SSA. • Estimated NUE’s for SSA exceed 100%. • This suggests that SSA is doing a remarkable job in managing fertilizer N • The reality is that so little fertilizer N is used that estimates of NUE are grossly exaggerated.
Summary • Reporting on these high NUE’s is important, but in light of N application rates they speak to a much bigger and potentially damaging situation for cereal production in SSA. • Limited supplies of N, the continual rise in prices and elevated economic risk of N fertilization, combined with the existing low yield levels of cereal production systems reiterates the importance of NUE in SSA and the importance of aiding this region in overcoming the challenges its agriculture production systems must take on. • The high NUE’s for SSA are a direct result of applying so little fertilizer N, at the ultimate expense of mining an already depleted soil resource.