Download
1 / 39
410 likes | 569 Views
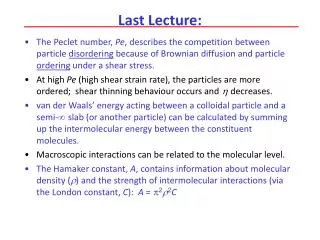
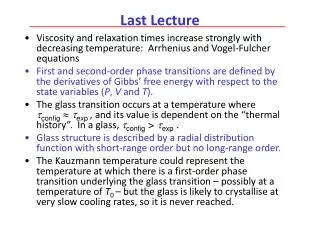
Last Lecture:. Viscosity and relaxation times increase with decreasing temperature: Arrhenius and Vogel-Fulcher equations First and second-order phase transitions are defined by derivatives of Gibbs’ free energy.

E N D
Last Lecture: • Viscosity and relaxation times increase with decreasing temperature: Arrhenius and Vogel-Fulcher equations • First and second-order phase transitions are defined by derivatives of Gibbs’ free energy. • The glass transition occurs at a temperature where tconfigtexp and is dependent on thermal history. In a glass, tconfig>texp . • Glass structure is described by a radial distribution function. • Liquid crystals have order between that of liquids and crystals.
Phase Separation 3SCMP 16 February, 2005 Lecture 5 See Jones’ Soft Condensed Matter, Chapt. 3
Today’s Question:When are Two Liquids Miscible? At a critical temperature, miscible liquids will separate into two phases.
Basic Guiding Principles • Recall from last week that dG = VdP-TdS. • Since, S increases or stays the same in an isolated system, at constant P, the condition for the thermodynamic equilibrium of a system is that the Gibbs’ free energy, G, goes to a minimum at equilibrium. • Likewise at constant V, the Helmholtz free energy, F, also goes to a minimum at equilibrium. • F = U - TS, so that in a phase transition at constant T: DF = DU - TDS. • We see that an increase in S or a decrease in U favours a transition. • Whether a transition occurs is thus decided by the balance between DU and DS.
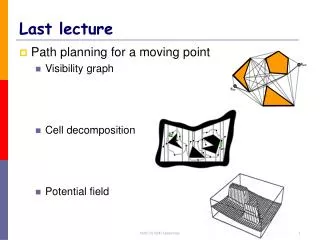
G + R GR mixture + Lower S Higher S
Higher S Let fR = Volume of Red Total Volume Let fG = Volume of Green Total Volume Why are some liquids immiscible if a mixture has a higher entropy? In immiscible liquids, U increases upon mixing. Assume red and green molecules have the same volume. Then assume fR + fG = 1 (non-compressibility condition).
Entropy Calculation from Statistical Thermodynamics S = k ln The thermodynamic probability,, represents the number of ways of arranging particles in a particular energy state.
The number of ways of arranging N distinguishable molecules on N “lattice” sites is N!. Therefore: But the Stirling approximation tells us that lnN! NlnN-N, for large N. Applying this approximation, we find: Change in S on Mixing, DSmix Let NR be the total number of red molecules and NG be the total number of green ones.
Simplifying by grouping NR and NG terms: If the volumes of red and green molecules are the same, then number fraction and volume fraction are identical: Substituting for ln(f -1) = - ln(f): Statistical Interpretation of DSmix (And likewise for fG.)
Then, DSmixper molecule can found by dividing by the total number of molecules (NR + NG): Note that we have moved the negative outside the brackets. Recognising fR and fG: D Smix Expressed per Molecule Our expression is the entropy change upon mixing all NR+ NG molecules: Next we need to consider the change in internal energy, U!
Change in U on Mixing, DUmix • Previously, we considered the energy of interaction between pairs of molecules, w(r), for a variety of different interactions, e.g. van der Waals, Coulombic, polar, etc. • We assume the interaction energies (w) are additive! • When unmixed, there are interaction energies between likemolecules only: wRR and wGG. • When mixed, there is then a new interaction energy between unlike molecules: wRG. • At a constant T, the kinetic energy does not change with mixing; only the potential energies change. • So, DUmix = WR+G - (WRR + WGG), which is the difference between the mixed and the unmixed states.
Mean-Field Approach • Describe the molecules as being on a lattice. • Assume random mixing. • Then the probability that a site is occupied by a red molecule is simply fred. • We will only consider interaction energies (w) between each molecule and its z closest neighbours - neglecting longer range interactions.
Summary Charge-charge Coulombic Dipole-charge Dipole-dipole Keesom Charge-nonpolar Dipole-nonpolar Debye Nonpolar-nonpolar Dispersive Type of InteractionInteraction Energy, w(r) In vacuum:e=1
Energy of the Unmixed State • Each molecule only “owns” 1/2 of the pair interaction energy. • For each individual molecule:
Energy of the Mixed State Probability that a neighbour is red Probability that a neighbour is green Probability that the reference molecule is green Probability that the reference molecule is red The mean-field approach assumes that a molecule on a given site will have zfR red neighbours and zfG green neighbours.
From before: Factor out f terms: Energy of Mixing, DUmix, per Molecule NB: As we did with entropy, we will consider the change in Uper molecule. DUmix = Umix - Uunmix But,fG + fR= 1, so that -fG = fR - 1 and fG -1 = -fR
The Interaction Parameter, c We now define a unitless interaction parameter, c, to characterise the the change in the energy of interaction when a red molecule in a pure red phase is swapped with a green molecule in a pure green phase: Interactions between R and G are gained, but interactions between R & R and between G & G are lost! We see thatccharacterises the strength of R-G interactions relative to their “self-interactions”.
and Substituting for c we now find: Free Energy of Mixing, DFmix We saw previously that: A simple expression for how the internal energy changes when two liquids are mixed. Depends on values of T and c.
Energetic (U) Contribution toDFmix Regular solution model c= 5 c <0 favours mixing! c= 3 c= 2 c= 1 c= 0 c= -1 c= -2
At constant temperature: Using our previous expression for DSmixmol: Factor out kT: Free Energy of Mixing, DFmix
Dependence ofDFmix on c Mixing not favoured Mixing is favoured Regular solution model c= 5 c= 3 c= 2 c= 1 c= 0 c= -1 c= -2
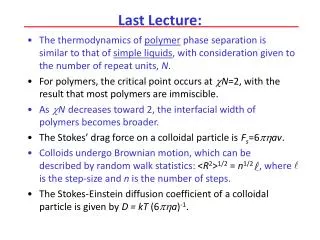
Predictions of Phase Separation Regular solution model c= 3 c= 2.75 c= 2.5 c= 2.25 c= 2
Summary of Observations We have assumed non-compressibility, that molecules are on a lattice, and that volume fraction and number fraction are equal. When c < 2, there is a single minimum atfR = 0.5 When 2 c, there are two minima in DFmix and a maximum at fR = fG = 0.5. As c increases, the two compositions at the DFmix minima become more different. How does this dependence ofDFmix on f determine the composition of phases in a mixture of liquids?
Initial: fG=0.7 Phase-Separated: fG=0.5 and fG=0.8 Phase Separation of Liquids
Free Energy of a System of Two Liquids • A system of two mixed liquids (G and R) will have a certain initial volume fraction of liquid G of fo. • At a certain temperature, this mixture separates into two phases with volume fractions of G of f1 and f2. • The total volume of the system is conserved when there is phase separation. • The free energy of the phase-separated system can be shown to be: Fsep can be easily interpreted graphically!
Fsep f1 f2 Free Energy of System with Lowc DFmix What if the composition fo was to separate into f1 and f2? . Then the free energy would increase from Fo to Fsep. Fo Conclude: Only a single phase is stable! fo 1 0
Fsep f1 f2 Free Energy of System with Highc DFmix What if the composition fo was to separate into f1 and f2? . Fo Then the free energy would decrease from Fo to Fsep. Conclude: Two phases are stable fo 1 0
F Does Not Always Decrease! Fsep 2* The stable compositions are f1 and f2*! What happens if fo separates into f1 and f2? F Then Foincreases to Fsep which is not favourable; f1 and f2 are metastable. . Fo f1 fo f2
Defining the Spinodal Point Negative curvature Positive curvature Spinodal F Two phases stable Spinodal region f Metastable
Determining a Phase Diagram for Liquids: Regular Solution Model Recall that: As the interaction energies are only weakly-dependent on T, we can say that c1/T. When c >2, two phases are stable; the mixture is unstable. Whenc<2, two phases are unstable; the mixture is stable. When 0 <c<2, mixing is not favoured by enthalpy (or U). But since mixing increases the entropic contribution to F, a mixture is favoured. A phase transition occurs at the critical point which is the temperature where c = 2.
Constructing a Phase Diagram Spinodal where: Co-existence where: T1<T2<T3<T4<T5 T1 T2 T3 T4 T5 T1<T2<T3….
Phase Diagram for Two Liquids Described by the Regular Solution Model Low T Immiscible Miscible High T fA
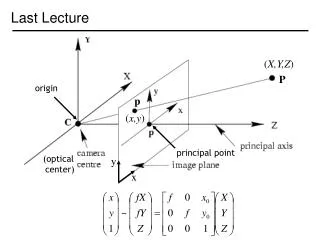
Interfacial Energy between Immiscible Liquids Imagine an interfacial area exists between two liquids: L F x • By moving the barrier a distance x, we increase the interfacial area by Lx. The force to move the barrier is F = gL, so that the work done is Fx = gLx = gA. • The interfacial tension (N/m) can also be associated with the energy to increase the interfacial area (J/m2). • The interfacial energy is a FREE energy consisting of contributions from enthalpy and entropy.
U or “Energetic” Contribution to Interfacial Energy At the molecular level interfacial energy can be modelled as the energy (or U) “cost” per unit area of exchanging two dissimilar molecules across an interface. For a spherical molecule of volume v, its interfacial area is approximately v2/3.
“Energetic” Contribution to Interfacial Energy The net energetic (U) cost of broadening the interface is thus: Thus we can write: Two new RG contacts are made: +2wRG, but at the same time, a GG contact and an RR contact are lost: - wGG - wRR
Entropic Contribution to g As a result of thermal motion, a liquid interface is never smooth at the molecular level. As the temperature increases, the interface broadens. There is an increase in gS, leading to a strong decrease ing. At the critical point,g= 0, and so the interface disappears!
Problem Set 3 1.The phase behaviour of a liquid mixture can be described by the regular solution model. The interaction parameter depends on temperature as c = 600/T, with T in degrees Kelvin. (a) Calculate the temperature of the critical point. (b) At a temperature of 273 K, what is the composition (volume fractions) of the co-existing phases? (c) At the same temperature, what are the volume fractions of the phases on the spinodal line? 2. Octane and water are immiscible at room temperature, and their interfacial energy is measured to be about 30 mJm-2. The molecular volume of octane and water can be approximated as 2.4 x 10⁻²⁹ m3. (a) Estimate the c parameter for octane and water. (b) What can you conclude about the difference between the interaction energy of octane and water and the “self-interaction” energy of the two liquids?