Download
1 / 20
200 likes | 322 Views
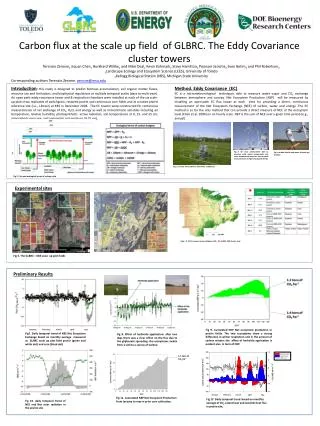
Enabling Carbon Flux Studies at the Regional and Ecosystem Scale. Deborah Agarwal BWC technical team 16 July 2007.

E N D
Enabling Carbon Flux Studies at the Regional and Ecosystem Scale Deborah Agarwal BWC technical team 16 July 2007
Applications of eddy covariance measurements, Part 1: Lecture on Analyzing and Interpreting CO2 Flux Measurements, Dennis Baldocchi, CarboEurope Summer Course, 2006, Namur, Belgium (http://nature.berkeley.edu/biometlab/lectures/)
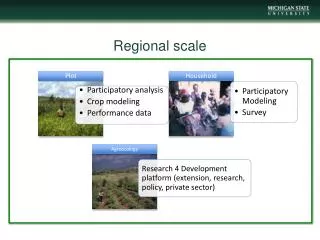
Carbon-Climate Analysis Goals • Towers measure consistent carbon flux and micrometeorological parameters • Tower researchers quality check data and then provide the data to regional archives. • Regional and global carbon-climate analysis activities rely on data from regional archives • Recent La Thuile workshop is gathering over 700 site-years of data available from over 200 sites around the world.
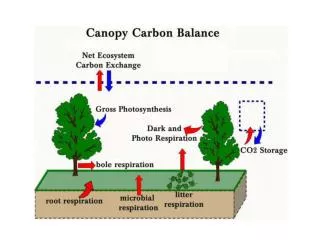
Measurements Are Often Not Simple or Complete • Gaps in the data • Quiet nights • Bird poop • High winds • …. • Difficult to make measurements • Leaf area index • Wood respiration • Soil respiration • … • Localized measurements – tower footprint • Local investigator knowledge important • PIs’ science goals are not uniform across the towers
Typical Data Analysis Flow Today Matlab, Excel, S-Plus, PV-Wave, R, … Web page, e-mail, web service, phone, Student, Post-doc, Friend, . . .
Target Data Analysis Flow Track versions, results, and provenance
Scientific Data Server - Overview Data Cubes Databases Data Ingest User Interfaces
Database • All descriptive metadata and data held in relational databases • Metadata is important too! • While separate databases are shown, the datasets may actually reside in a single database • Mapping is transparent to the scientist • Separate databases used for performance • Unified databases used for simplicity • New metadata and data are staged with a temporary database • Minimal quality checks applied • All name and unit conversions • Data may be exported to flat file, copied to a private MyDb database, directly accessed programmatically, or ?
Data Cubes • A data cube is a database specifically for data mining (OLAP) • Simple aggregations (sum, min, or max) can be pre-computed for speed • Additional calculations can be computed dynamically or pre-computed • Both operate along dimensions such as time, site, or datumtype • Constructed from a relational database • A specialized query language (MDX) is used • Client tool integration is evolving • Excel PivotTables allow simple data viewing • More powerful analysis and plotting using Matlab and statistics software
Scientific Data Server – User Interface Reports, Web Services, Excel Pivot Table and Pivot Chart CSV Files ORNL Ameriflux Web Site Data Cube BWC SQL Server Database
Browsing For Data AvailabilitySites Reporting Data Colored by Year
Required variable reporting by site by year • Each row corresponds to one site-year • Each cell corresponds to one site year of (FC, CO2 or SCO2, UST, PAR or Rg, TA, and Rh or H2O). • Color indicates: • Red – likely not enough for processing - % < .3 reported (roughly less than 5K of 17.5K) • Green – likely not enough for processing .3<%<.999 • Yellow – may not be good for processing due to gap-filling - % > .999 • Red CO2 (second column) can be ignored for cropland/grassland sites • Sites shown are just a sample Of the 285 site years with good FC, 50 site years are missing one of (UST, PAR/Rg, and TA) and 79 sites have likely gap-filled data.
Obviously bad annual averages Data cube used to browse average yearly Rg values across all site-years 16 additional likely problematic site-years at 5 sites
Drill down to consistent (bad) daily values Data cube used to browse 2005 Rg values shows consistently high reporting (not just a few very large spikes) at Duke Forest sites
Drill down to Mead sites Daily average FC at each site shows likely units and/or sign issues
Simple check: the same FC value reported too often • Database query returns count by (site, year, value) where count >= 500 • Graph shows sum of (returned counts) by site and year • Sites with high sums likely report very few unique FC values
Project Status Ameriflux data ~145 million daily values in cube Advanced calculations and statistics in cube Methods of providing ½ hourly data access efficiently Data quality assessment Collection and incorporation of biological data Fluxnet data ~210 million daily values in cube Waiting on gap filling and quality checking operations Data server, cubes, and reports will likely be the primary repository and access for researchers using the data Russian River Data ~23 million values in cube Integration with Matlab and GIS Additional of data from other sources (fish, sediment size, …)
On-going and Future Challenges Versioning of data and collection of data provenance Improved performance of database and cube Handling of biological data Advanced plotting capabilities Integration of collaborative tools Automation of data ingest, cube building, and report building MyDB and MyCube capabilities Integration of workflow capabilities Data server in a box Sociological change
Summary Ameriflux collaboration is adopting the Data Server architecture for the data repository BWC Data Server will be hosting the Fluxnet dataset which is expected to be the foundation for a broad range of research investigations Ecological measurements are often “messy” Applying the Data Server to watersheds introduces many additional challenges
Acknowledgements • Ameriflux Collaboration • Dennis Baldocchi • Beverly Law • Tara Stiefl (student) • YoungryelRyu (postdoc) • Gretchen Miller (student) • Mattias Falk • Tom Boden • Bob Cook • CarboEurope Collaboration • Dario Papale • Markus Reichstein • *Project funded by Microsoft Berkeley Water Center, University of California, Berkeley, Lawrence Berkeley Laboratory Jim Hunt Matt Rodriguez Monte Good Rebecca Leonardson (student) Carolyn Remick Susan Hubbard YoramRubin Microsoft Catharine van Ingen JayantGupchup (student) Tony Hey Dan Fay Stuart Ozer SQL product team Jim Gray