Download
1 / 49
490 likes | 568 Views
EARTH SATELLITE CORPORATION’S HEATING SEASON WEATHER SEMINAR. September 2000. SEMINAR GOALS. What’s new in the weather Visit the hurricane season outlook Examine the status of conditions across the Pacific Explain the EarthSat Forecast Model

E N D
EARTH SATELLITE CORPORATION’SHEATING SEASON WEATHER SEMINAR September 2000
SEMINAR GOALS • What’s new in the weather • Visit the hurricane season outlook • Examine the status of conditions across the Pacific • Explain the EarthSat Forecast Model • What to Monitor This Heating Season • Illustrate the monthly and seasonal outlooks
HEATING SEASON HIGHLIGHTS WINTER 2000/2001 FORECAST WINTER 1999/2000 ACTUAL • 2000/2001 winter, colder than last three (3) winters. • November and December colder than normal months. • January, February, and March warmer than normal months.
WHAT’S NEW IN WEATHER RMS and EarthSat Introduce New Product CLIMETRIX A comprehensive weather risk management system 1. Catalog of Cleaned and Enhanced Historical Data • initial focus on U.S. temperature data • next stage is international expansion • future addition of other temperature variables 2. Transaction Pricing Tools • advanced simulation models • multi-perspective risk analysis 3. Portfolio Management Capabilities • data management • daily marking of positions www.climetrix.com
RMS - EARTHSAT PARTNERSHIP A multidisciplinary team has been conducting research on historical data enhancement for more than 1 year. • Expertise in modeling, actuarial science, and risk analysis • A culture of deep investigation of historical events • Meteorological expertise and experience with weather recording processes • Long history of analyzing, processing, and distributing weather data
WHAT’S NEW IN WEATHER National Weather Service Temperature Graphics -rankings and departure from normal http://www.cpc.ncep.noaa.gov/products/analysis_monitoring/regional_monitoring/usa.html National Weather Service Temperature Trends -long term seasonal temperature trending http://www.cpc.ncep.noaa.gov/charts.htm
WHAT’S NEW IN WEATHER Winters Getting Warmer. Summers Getting Cooler.
WHAT’S NEW IN WEATHERTHE 1990’s Decembers - Februarys WARMER WINTERS Junes - Augusts COOLER SUMMERS
WHAT’S NEW IN WEATHER1990’s NOVEMBERS 1990’s Novembers Start of Heating Season Typically Colder in the 1990’s.
WHAT HAPPENED TO THE SUMMER? Forecasts From April 2000 NATIONAL WEATHER SERVICE EARTH SATELLITE CORPORATION
SUMMER 2000 (June – August) • Strong Eastern Canada Trough Dominates • Warm Pacific Supports Western Ridge • Patterns Remain Very Volatile In East South and West See Best Scoring.
6-10 DAY VERIFICATION Bottom Line: So far this cooling season EarthSat is ~10% more accurate vs. NWS
6-10 DAY VERIFICATION Bottom Line: EarthSat almost 30% more accurate vs. NWS
SHORT RANGE VERIFICATION(1-3 Day Forecasts) Cities Tested: ATL, CVG, LGA, PHL ~7% better than TWC ~10% better than mean ~16% better than TWC in Cincy
2000 HURRICANE SEASONWHERE WE STAND….. LAST YEAR CURRENT SEASON Bottom Line Slow start to the 2000 season
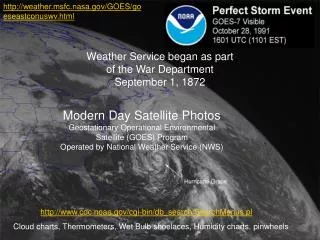
CURRENT CONDITIONSWEST AFRICA SEPTEMBER 6, 2000 PRECIP. PERCENT OF NORMAL AUGUST 1, 2000 – SEPTEMBER 6, 2000
CURRENT CONDITIONSSEA SURFACE TEMPERATURES September 2, 2000
2000 HURRICANE SEASONBOTTOM LINE June 1, 2000 Forecast September 1, 2000 CurrentForecast Seasonal Normals Named Storms 11 4 10 9 Hurricanes 7 2 6 7 Intense Hurricanes 3 1 3 2
TROPICAL PACIFIC CURRENT STATUS Prepared: September 7, 2000 • Equatorial Pacific Water Temperatures (SST) • Surface layers +0.5 C to –1.0 C from normal. • Sub-surface layer warming back to normal. • Southern Oscillation Index (SOI) • Five month SOI is (+0.1). • August SOI is (+0.3). • Pacific Outgoing Long Wave Radiation (OLR) • Near normal convection. • Normal precipitation. • Trade Winds (850mb Zonal Wind) • Trade winds returning to normal levels. NEUTRAL CONDITIONS IN PLACE….
PACIFIC SEA SURFACE TEMPERATURES (SST) Surface Temperatures Change In Sub-Surface
Nino 3.4 SEA SURFACE TEMPERATURES NEUTRAL Expected Trend WEAK LA NINA MODERATE LA NINA La Nina Intensification Seen Late Last Summer 1999 STRONG LA NINA 2000
PACIFIC SOUTHERN OSCILLATION INDEX (SOI)
PACIFIC OUTGOING LONGWAVE RADIATION (OLR) Clear Skies La Nina Signature Cloud Cover Increasing – Neutral Phase
RUNNINGTHE MODEL Analyze latest SST Consolidation forecast for NOAA • Use historical and forecast data for the Nino3.4 region (Tropical Pacific) • Cross reference SST data with SOI data Use weighted differencing to calculate closest ten years • Historical SST data back six months • Forecast SST data forward six months • Analog years determined and weighted inversely by difference • Best fit analog years are assigned the highest weight Other considerations • Neutral phase conditions are highly considered in the 10 analog years • Decadal adjustments of analog years to fit the 90’s temperature profile Generate temperature/precipitation forecasts • Maps created using monthly temperature data from NCDC (1950-present) • Mapping program using 344 data points (climate divisions) for the display
Decadal Adjustment Theory *Based on the theory that temperature trends are cyclic *Analog years from other decades are adjusted to the 1990’s
EARTHSAT MODEL RUN September 2000 SIMILAR PERCENT YEARS WEIGHT (Fall/Winter) (%) 19.5 11.4 10.9 10.0 9.1 8.5 8.1 8.0 7.3 7.2 1989/90 1978/79 1981/82 1985/86 1952/53 1996/97 1974/75 1962/63 1967/68 1971/72
WHAT TO MONITORFOR THE HEATING SEASON • Greenland Blocking (North Atlantic Ridging) • Hudson Bay Low • Ridging in Western North America • Cold Air in the Source Region • Snow Cover Between the U.S. and Arctic • East Coast Storms (Snow Producers)
EAST COAST STORMS Severe temperature gradient. Should help storm development.
WHAT TO MONITOR GREENLAND BLOCKING
WHAT TO MONITOR NORTHERN U.S. / CANADA SNOW COVER
NATIONAL WEATHER SERVICE COMMENTARYFrom the Long-lead Prognostic Map Discussion August 17, 2000 • “SST anomalies in the Pacific became ENSO-Neutral during mid-July to mid-August.” • “On average – this winter will be colder than the last three.”
WINTER TEMPERATURE OUTLOOKS
WINTER TEMPERATURE OUTLOOKS
WINTER TEMPERATURE OUTLOOKS
INSIDE THE NUMBERS (HDD Outlook) Chicago Nov-Dec: 120% Jan-Mar: 75% New York Nov-Dec: 115% Jan-Mar: 80% Burbank Nov-Dec: 95% Jan-Mar: 90% Atlanta Nov-Dec: 90% Jan-Mar: 75% Houston Nov-Dec: 100% Jan-Mar: 85%
HEATING SEASON CONCLUSIONS WINTER 2000/2001 FORECAST WINTER 1999/2000 ACTUAL • 2000/2001 winter, colder than last three (3) winters. • November and December colder than normal months. • January, February, and March warmer than normal months.
COMPARE & CONTRAST – FALL 2000 NATIONAL WEATHER SERVICE EARTH SATELLITE CORPORATION
COMPARE & CONTRAST – Early Winter NATIONAL WEATHER SERVICE EARTH SATELLITE CORPORATION
COMPARE & CONTRAST – Late Winter NATIONAL WEATHER SERVICE EARTH SATELLITE CORPORATION
EARLY SUMMER 2001 TEMPERATURE OUTLOOKS
SUMMER 2001 TEMPERATURE OUTLOOKS
PACIFIC NORTHWEST HYDRO OUTLOOK • Drier than normal for the rest of 2000 • Wetter than normal in early 2001