Download
1 / 76
760 likes | 954 Views
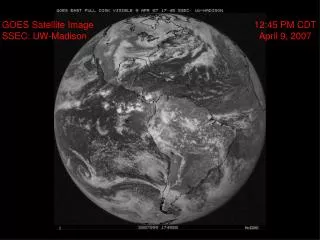
http://weather.msfc.nasa.gov/GOES/goeseastconuswv.html. Weather Service began as part of the War Department September 1, 1872. Modern Day Satellite Photos Geostationary Operational Environmental Satellite (GOES) Program Operated by National Weather Service (NWS).

E N D
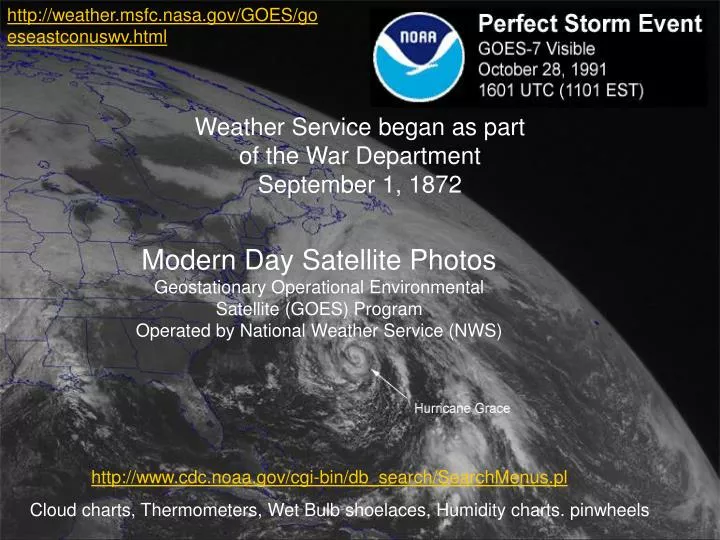
http://weather.msfc.nasa.gov/GOES/goeseastconuswv.html Weather Service began as part of the War Department September 1, 1872 Modern Day Satellite Photos Geostationary Operational Environmental Satellite (GOES) Program Operated by National Weather Service (NWS) http://www.cdc.noaa.gov/cgi-bin/db_search/SearchMenus.pl Cloud charts, Thermometers, Wet Bulb shoelaces, Humidity charts. pinwheels
Density falls off with altitude; pressure is caused by impacts, dense air has more impacts
Buoyancy Lifting Start Local Heat Air Expands Dense Air Jiggles Underneath (heated atoms speed up paddle board analogy) Atoms close together (dense, high pressure) “fall into” the empty (low pressure) area forces warm air up
WIND • Wind is caused by differences in pressure • Pressure and Density of air are two aspects of the same thing • Atoms close together (in dense, high pressure areas ) “fall into” the empty (low pressure) area
The greater the contrast in pressure the faster the wind. One atmosphere (pressure at surface) is about 1000 millibars These red isobars are lines of equal pressure L H
Pressure Gradients Coriolis turning Initially wind flows from high to low but Coriolis turns it nearly parallel to lines of equal pressure (isobars)
Winds blowing parallel to isobars are called geostrophic winds This occurs well above the surface where there is no friction Notice pressure gradient force always from high to low pressure, but Coriolis perpendicular to actual flow direction
Winds blowing parallel to isobars are called geostrophic winds Winds Aloft, maybe 3 km up Wind speed feathers on the “from” end. Winds named for the “from” direction
Friction turns surface winds back toward the pressure gradient. Near the surface, winds almost move from High to Low pressure They spiral counterclockwise into a Low in Northern Hemisphere
Near the surface, winds almost move from High to Low pressure They spiral counterclockwise into a Low in Northern Hemisphere L lowest local pressure Blue arrows PGF Red arrows Coriolis Black arrows wind path L
Polar Cell Ferrel Cell Hadley Cell Since earth’s rotation turns air, flows are broken into 3 cells per hemisphere
Horizontal temperature differences Temperature effects density and pressure: If you heat something it expands and gets less dense A 500 millibar pressure level is much higher in hot air. Hotter air has lower density and greater volume P = r R’ T so T = P /r R’ 500 mb 700 mb 850 mb 1000 mb Psurface Warm Cold
Polar Jet Formation Steep gradients of Pressure cause higher velocity geostrophic winds. This is the trigger for jet stream flow. LOW _____________________HIGH
Polar air is denser, so it wedges under the low density warm air. Rotation causes an eddy to form For the Polar Jet, the eddy is in the Ferrel cell on the upper polar side, and so air flows from the west to the east, the “Westerlies” Since the pressure difference is great at the boundary, the jet is a very fast wind
Air Masses • An air mass develops when the atmosphere is located above a relatively uniform land or water surface for several days. • The lower atmosphere assimilates some of the properties of the underlying surface.
Air Masses • Large regions (1,000s km2) of the lower troposphere with uniform characteristics (temperature, moisture content) originally defined by a source area. • Labels refer to temperature (arctic vs. polar vs. tropical) and source area (continental vs. maritime). The source area determines the moisture content. • Labels around here: cT cP mT mP
http://www.met.tamu.edu/class/Metr304/Dir-surface/surface.html~http://www.met.tamu.edu/class/Metr304/Dir-surface/surface.html~ Polar air enlarges and moves further south during winter and retreats northward during summer.
Typical Air Mass Changes Heating (cP air moving south) will lead to instability (bouyancy) as warms. Cooling (mT air moving north) has the opposite effect, because colder air cannot rise Orographic Lifting forces maritime mP and mT air upward over mountain ranges in the western U.S., leading to condensation and precipitation that converts the formerly humid air to a much dryer air mass.
Air Mass Interactions • Weather in any region is influenced by the interactions between air masses. Recall that the boundaries between contrasting air masses are called FRONTS cP mT
cP mT Heavy rains can result from the interaction between the continental polar cP air mass and the maritime tropical mT air mass
Mid-latitude Cyclones ExtraTropical Cyclones are up to 2,000 km across & control the weather for three days to a week. Winds circulate counter-clockwise (CCW) around the Low in Northern Hemis. L Def: Synoptic Scale: space and timescales of mid-latitude depressions i.e. several thousand kilometers and timescales of several days
8. Cold air sinks HIGH Polar Cell LOW 7. Mid-Latitude Cyclones are dominant where Ferrel meets Polar 4. Ferrel Cell Mid-Latitude Cyclones north Dry south 5. HIGH 6. Gyre 2. 3. to E 0. Maximum heat from Sun LOW 1. ITCZ
Dishpan Experiment Why are the boundaries between cold and hot not straight? Cold mass is denser and forces its way under the warmer mass Camera rotates with dish Cold Center hot edge Large scale waves and eddies form They flow CW & CCW Rossby Waves
Mid-Latitude Cyclones • This clash between cP and mT air masses is the most common source of frontal systems in the U.S. • Weather conditions, and cloud types, change in a predictable sequence as warm and cold fronts pass over an area. • A front is a transition from one air mass air mass to another
http://www.met.tamu.edu/class/Metr304/Dir-surface/surface.html~http://www.met.tamu.edu/class/Metr304/Dir-surface/surface.html~ cP mT
Warm Front • Ahead of a warm front, warm, humid air is transported upward over a distance of approximately 1,000 km (625 miles). • Rain may last longer than for a cold front because the warm front moves slowly and extends over a larger area. Dangerous storms if cold air is very cold
Warm Front Clouds and Winds • First sign of warm front is sequence of clouds (cirrus, cirrostratus, altostratus). • If winds are right, up to 12 hours after the cirrus, the higher clouds will be replaced by lower nimbostratus with associated light to moderate precipitation. • Temperatures and humidity rise and winds typically shift direction (first from the south or southeast, then from the southwest) with the passage of the warm front.
Warm Front Changes Expect increasing Temperature and Humidity as the warm front passes
Cold Frontchanges • Cold, dense continental polar air cP replaces moist, warm maritime tropical air mT across a cold front • Expect decreasing temperature and humidity and increasing atmospheric pressure with the passage of the cold front.
Warm Air Rises • Warm wet air has lowest density, so it will always rise over cooler air. • Both the cold and warm fronts are inclined toward the warm air mass.
Approaching Cold Front is behind Thunderstorms Warm air is pushed up and over the advancing cold front, causing relatively rapid cooling and condensation that results in the development of tall cumulonimbus clouds. They host heavy but relatively short-lived precipitation
Cold Front cloud bands are narrow because cold front wedges are steep
Cold Fronts are narrow because the edge of the cold air mass is steep http://www.emc.ncep.noaa.gov/mmb/gmanikin/nas125/tstorm/squall1.gif
A Cold Front Squall Line Rapidly advancing cold fronts may be marked by the growth of a squall line of thunderclouds
Cyclogenesis 1 – Stationary Front A small scale wave forms cP mT These persist if the air masses have equal pressure Then many small waves form, and storms are very frequent Mid-Latitude Cyclones start as Stationary Fronts.
Cyclogenesis 2 – Warm and Cold Fronts cP mT In the Ferrell cell, winds have a strong westerly component, and storms move East. As they mature and move, Warm Fronts pass over, followed by Cold Fronts.
Cyclogenesis 3 – Occluded Front forms Where the cold front catches up, they are called Occluded Fronts. Note symbol. cP mT Cold front catches warm, forcing warm air aloft. Broad precipitation area results.
Occluded Fronts • The cold front is faster than a warm front and will eventually close the gap between the fronts, forcing the intervening warm air upward generating additional rain mT Nimbostratus cP Rain then covers a wide area
Storm evolution 1. Surface map, so winds cross Isobars and spiral into the LOW Along the occluded front warm moist air is force aloft, resulting in a broad band of rain 2. Wide precipitation band mT mT cP cP
Thunderstorms • Thunderstorms form where warm, humid air is forced upward to altitudes of up to 15 km (20 for supercells). • Condensation occurs as the air cools, releasing latent heat and ensuring that the rising air remains unstable (warmer so less dense than surrounding air).
Rising Warm air overshoots into stratosphere Prevailing Wind Aloft Freezing Line Condensation Line Surface
Type 1: Isolated Thunderstorms from unstable (hot, moist, low density) air Rain, plus gusty winds caused by downdrafts Droplets coalesce 15 minutes Only updrafts. No rain. All downdrafts Rain and Ice too heavy for updrafts Lasts 15 to 30 minutes
Lightning http://www.nssl.noaa.gov • Most dangerous frequently encountered weather hazard that people commonly experience each year. • Second most frequent weather killer in the United States with nearly 100 deaths and 500 injuries each year, after floods and flash floods
Lightning equalizes large charge differences between storm levels and the ground Ice often positive + marks concentrations of rising and falling ice
2. Synoptically Forced Thunderstorms Most of the cloud formation associated with a cold front is actually in the warm moist air mass
Supercells • Severe thunderstorms, or supercells, are associated with frontal lifting along the cold front between the continental polar and maritime tropical air masses in mid-latitude cyclones. The lower portion of these storms, the mesocyclone, rotates. They often contain severe hail and sometimes tornadoes. • Most common during spring and early summer, when the contrast in temperatures and moisture between air masses is greatest.