Download
1 / 4
60 likes | 336 Views
other paired-comparison statistics. first consider the sign test … our data consists of pairs of data (x,y) on which we’ve taken differences, D i , i=1,…,n. Instead of ranking the absolute differences and attaching a sign as we did with the Wilcoxon signed-rank test, we’ll only consider

E N D
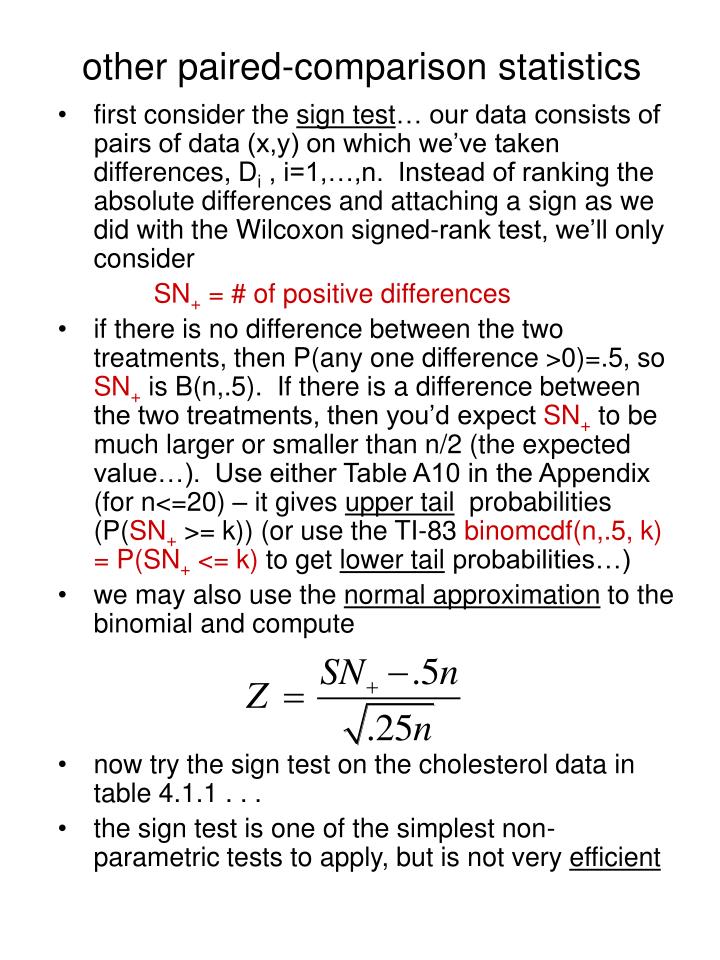
other paired-comparison statistics • first consider the sign test… our data consists of pairs of data (x,y) on which we’ve taken differences, Di , i=1,…,n. Instead of ranking the absolute differences and attaching a sign as we did with the Wilcoxon signed-rank test, we’ll only consider SN+ = # of positive differences • if there is no difference between the two treatments, then P(any one difference >0)=.5, so SN+is B(n,.5). If there is a difference between the two treatments, then you’d expect SN+to be much larger or smaller than n/2 (the expected value…). Use either Table A10 in the Appendix (for n<=20) – it gives upper tail probabilities (P(SN+>= k)) (or use the TI-83 binomcdf(n,.5, k) = P(SN+ <= k) to get lower tail probabilities…) • we may also use the normal approximation to the binomial and compute • now try the sign test on the cholesterol data in table 4.1.1 . . . • the sign test is one of the simplest non-parametric tests to apply, but is not very efficient
see page 127 for a discussion of the relative efficiencies of some of the paired tests we’ve been considering in Chapter 4. assuming the shift alternatives as with the two-sample tests, the paired t-test does best when the distribution of differences is normal, but when the distribution has heavy tails, the signed-rank statistic is more efficient: • ARE of the signed-rank test to the paired t-test is .955 for normally distributed differences • ARE of the signed-rank test to the paired t-test is 1.5 for double exponential distribution • ARE of the sign test to the signed-rank test is 2/3 when distribution is normal • ARE of the sign test to the signed-rank test is 1.3 when the distribution is Cauchy • Do #4, 5, and the second part of #6 on page 142… try both SAS and R implementations… • For SAS, go to the help menu and search for “signed-rank” or “sign test” – go over the help file to see how SAS computes the sign and the signed-rank statistics…
Randomized Complete Block designs: • homogeneous blocks are created so that units or experimental conditions are similar within blocks • assign treatments randomly to experimental units within the blocks so that each treatment occurs once in each block • assumes no interaction between treatments and blocks: • See the top of page 129 for the F-statistic when the error term is assumed to be normal(0,) • If normality cannot be assumed for the error terms, then we have two choices: • use a permutation test with the same F-statistic (permuting the observations within the blocks only) as we’ve been doing in other situations… • use Friedman’s Test by ranking the observations within the blocks and then comparing the average ranks for each treatment across all blocks with their expected mean (if no difference in treatment effect) in: here there are k treatments and b blocks… FM has approximately a chi-square distribution with (k-1) d.f. assuming no difference in treatments.
Note the adjustment for ties on page 134 or the alternate one on page 135. • See the note on page 136: “Friedman’s test is generally not as powerful as either the F-test or the permutation F-test for randomized complete block designs … but is generally more effective for a larger number of treatments” • In R, friedman.test(y), where y is a matrix with blocks in the rows and treatments in the columns. See Table 4.5.3 on page 135 for example: bl1=c(100,100,150,150) bl2=c(80,80,80,90) bl3=c(50,60,80,90) y=t(as.matrix(data.frame(bl1,bl2,bl3))) #Now apply friedman.test to y #Don’t forget t means “transpose” • HW: Page 142, #7,9