Download
1 / 6
70 likes | 202 Views
Figure 13.1 Sensory analytical discrimination test – paired comparison and A/not-A. Figure 13.2 Sensory analytical discrimination test – triangle. Figure 13.3 Sensory analytical discrimination test – duo-trio. Figure 13.4 Sensory analytical discrimination test – dual standard.

E N D
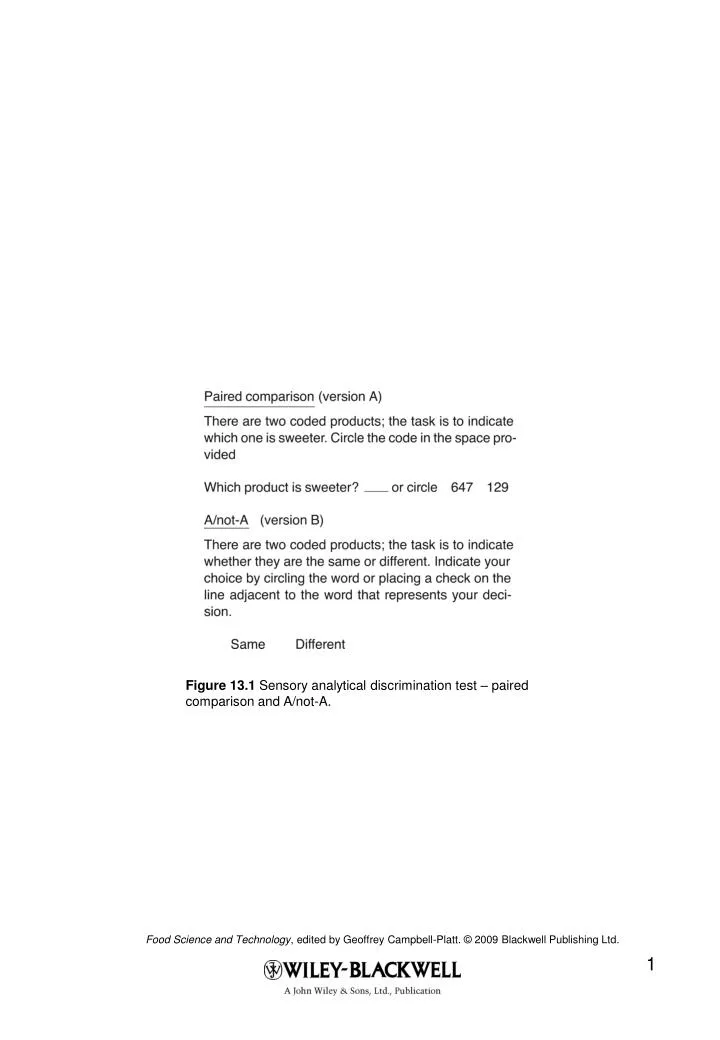
Figure 13.1 Sensory analytical discrimination test – paired comparison and A/not-A.
Figure 13.2 Sensory analytical discrimination test – triangle.
Figure 13.3 Sensory analytical discrimination test – duo-trio.
Figure 13.4 Sensory analytical discrimination test – dual standard.
Figure 13.5 QDA spider plot of sensory attributes. Each spoke in the wheel represents a sensory attribute. Entries are product mean values for each attribute. At the center of the wheel = low intensity; at the end of each spoke = higher intensity. Products that exhibit quantifiable sensory differences can be evaluated by target consumers. Then, by using a variety of multivariate analysis techniques, the key sensory characteristics that most influence target consumer liking can be designed into products, as well as providing a benchmark versus key competition. When consumer-based sensory evaluation techniques are used in conjunction with marketing and marketing research techniques, it provides an effective business strategy for brand management.
Figure 13.6 Example of a QDA spider plot of fruit yogurt. Results illustrate product similarities and differences by attribute. Control was: Higher/Stronger in Overall Flavor, Bitter Taste, Sour Taste, Thick Mouthfeel, and Lingering Aftertaste; Lower/Weaker in Sweet Taste, Yogurt Flavor, and Raspberry Flavor.