Download
1 / 7
70 likes | 232 Views
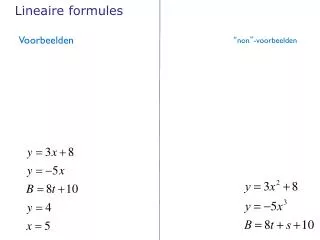
Lineaire Verbanden. Hoofdstuk 3. Een grafiek tekenen. Y = 3x – 2. 3 ·2 – 2 = 4. 3 ·0 – 2 = - 2. 3 ·1 – 2 = 1. Paragraaf 1. Een lineair (liniaal) verband is altijd een rechte lijn. De algemene formule van een lineair verband is y = a x + b

E N D
Lineaire Verbanden Hoofdstuk 3
Een grafiek tekenen Y = 3x – 2 3·2 – 2 = 4 3·0 – 2 = - 2 3·1 – 2 = 1
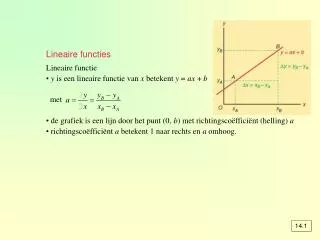
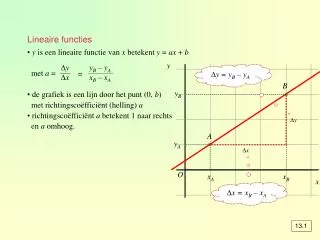
Paragraaf 1 • Een lineair (liniaal) verband is altijd een rechte lijn. • De algemene formule van een lineair verband is y = ax + b • Als je één stap opzij gaat, ga je a omhoog/omlaag. • De y-as wordt gesneden in het punt (0,b)
y = 2x + 3 • De standaardformule was: y = ax + b • y = ax + b • y = 2x + 3 a = 2 b = 3 • Dus deze grafiek “begint” bij (0,3) • En als ik één stap opzij ga, ga ik 2 omhoog.
Paragraaf 2 Lijn l: y = ax + b y = ax + 2 y = 2x + 2 • Lijn m: • y = ax + b • y = ax + 2 • y = ⅓x + 2 • Lijn k: • y = ax + b • y = ax + 5 • y = - 2x + 2 De grafiek gaat door de y-as bij 2, dus b = 2 De grafiek gaat door de y-as bij 2, dus b = 2 De grafiek gaat door de y-as bij 5, dus b = 5 3 opzij is 1 omhoog. 1 opzij is dus ⅓ omhoog. Dus a = ⅓ 2 opzij is 4 omlaag, 1 opzij is dus 2 omlaag. Dus a = - 2 1 opzij, is 2 omhoog, dus a = 2
Hellingsgetal • Y=ax + b • B, is makkelijk… Hier “begint” de grafiek (snijdt de grafiek de y-as) • a is moeilijker, want dat kan ik niet altijd aflezen!
Hellingsgetal Agrarische sector krijgt klappen. In 1980 nog 8800 bedrijven, in 2000 nog maar 5500. • 20 opzij, 3300 omlaag. 1 opzij 3300 : 20 = 165 omlaag. • a = - 165 verticaal . • a = horizontaal