Download
1 / 36
360 likes | 366 Views
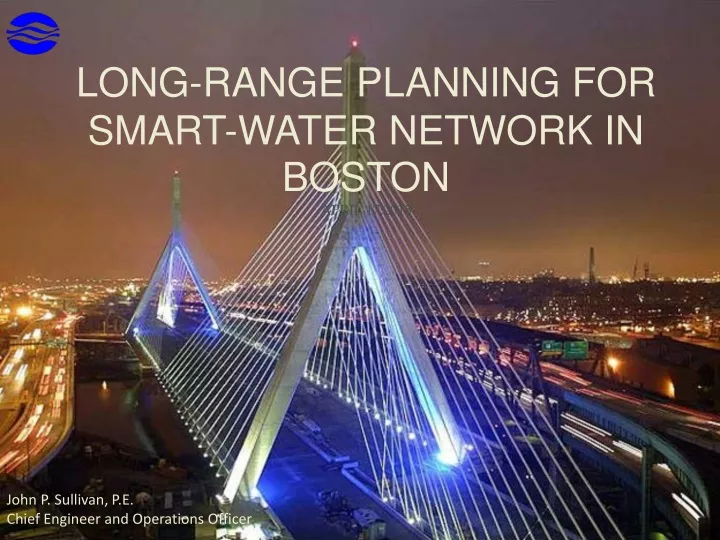
Long-Range Planning for Smart-Water Network in Boston April 17,2015. John P. Sullivan, P.E. Chief Engineer and Operations Officer. Agenda. Background and System Characteristics In place systems and technologies Future Smart- Water network Challenges.

E N D
Long-Range Planning for Smart-Water Network in BostonApril 17,2015 John P. Sullivan, P.E. Chief Engineer and Operations Officer
Agenda • Background and System Characteristics • In place systems and technologies • Future Smart- Water network • Challenges
MWRA is a Regional Water and Wastewater Wholesaler • MWRA provides wholesale water and wastewater services to over 2.5 million customers in 61 communities • On average, MWRA delivers an average of 200 million gallons per day to its water customers, with a peak demand of 350 million gallons • MWRA collects and treats an average of 350 million gallons of wastewater per day, with a peak capacity of 1.2 billion gallons
MWRA Water System Overview MWRA Quick Facts: • 150 miles of tunnel and 300 miles of pipe • 11 storage tanks and 10 pump stations • 890,000 households and 5500 businesses • 63 local storage tanks • No Retail Connections City of Boston
Boston’s Water Distribution System • Five pressure zones 60 psi -112 psi • Supplied from 29 metered locations • 1011 miles of pipe from 4 inch to 48 inch • Approximately 18214 valves • 13,618 hydrants • 90,000 Accounts
Boston Water Use 1900-2014 Source: MWRA
Current Water Management • Active Asset Management of Physical Plant • MWRA Water Quality Monitoring (Supply) • Master Metering and Alarms • AMI • Leak detection
Baseline Characterization - Source Water • Quabbin Reservoir • Swift River • 412 billion gallons • Wachusett Reservoir • Nashua River • Quinapoxet River • Stillwater River • 65 billion gallons Norumbega Covered Storage Quabbin Reservoir (Winsor Dam)
Baseline Characterization - Treatment • John J. Carroll Water Treatment Plant – Marlborough, MA • Serving Metro West and Metro Boston Communities • Treatment • Ozone • Sodium Bisulfite • UV • Sodium Hypochlorite • Hydrofluorosilicic Acid • Sodium Carbonate • Aqueous Ammonia • Carbon Dioxide
Infrastructure Concerns for the Monitoring Space • Environmental Controls • Heating and Cooling • Utilities • Power • Communication • Test Stream • Proximity to feed source • Feed and return lines • Drain Arlington Covered Reservoir
MWRA Monitoring System • Parameters monitored: • pH • Temperature • Conductivity • Turbidity • Dissolved Organic Carbon • Total Organic Carbon • Nitrate-N • UV 254 • Oxidation-Reduction Potential • Monochloramine • Free Chlorine • Total Dissolved Solids
Alarming Strategy Collect Alarm Data • Criteria • Location/Type • Duration • Cause Grouping • Sensitivity • Condition limits • Duration of condition
Automated Metering Reading System • System operating successfully for over 12 years • 90,000 residential/commercial meters • Four reads per day for each meter – 99% accuracy • Updating system to obtain hourly readings • Transmits over a secured FCC licensed frequency • Reduced calls to Customer Service 74% Reduction in Customer Service Calls
Proactive Customer Service • Collected data used to support analyses for: • Daily Consumption Review – High/Low usage • Consumption Analysis – Trends/Patterns – Failing Meters • Anomalies – Theft/Broken Meters • Leak Detection • Customer Service - Web
Data Collection Units (DCU) Locations • 62 DCUs • Boston School Department • Non-School Locations • EDIC • 1 Ashburton Place • Boston University
Account Information on Web • Enable customers • Consumption data by area
Current Upgrade • More accurate data - From 4 reads to 24 reads/day • Two-way communication • Switch from cellular to WiFi protocol • Improved analysis of data • More robust reporting - Better customer service
Identify Sources of Lost Revenues • Leaks • Under-registering meters • Theft • Non-metered accounts • Non-metered construction flushing • Construction bypass • Un-permitted street sweepers • Other unaccounted-for water
Leak Detection Efforts • 6 full time personnel • 3 additional as needed • Required to survey entire system every 2 years
Zonescan • Permanent • Pinpoints location • Drive-by reading • Scalable to fixed radio
smarter Leak Detection Methods needed • Permaloggers
What problems are we solving?(and at what cost?) • Low Water Main Break Frequency • Unaccounted for water - 8% • No pumping costs • No tanks • No Pressure problems • Minimum water quality complaints
What Next ? • Install water quality monitoring system within Distribution system • Simple, noise limited • Install distribution leak monitors; integrate with master meters, DMA meters, Customer meter data • Challenge – Cost Effective, Avoid Data Overload, Useful, Sustainable