Download
1 / 29
290 likes | 394 Views
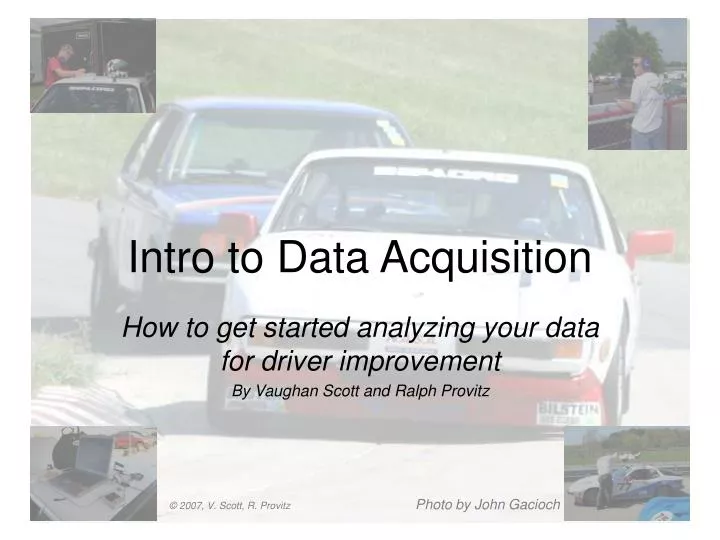
Intro to Data Acquisition. How to get started analyzing your data for driver improvement By Vaughan Scott and Ralph Provitz. Photo by John Gacioch. © 2007, V. Scott, R. Provitz. Overview.

E N D
Intro to Data Acquisition How to get started analyzing your data for driver improvement By Vaughan Scott and Ralph Provitz Photo by John Gacioch © 2007, V. Scott, R. Provitz
Overview • Data Acquisition Systems, or Data Loggers, will continuously save a number of data, or channels, while on-track. These usually include speed and lap times, at a minimum. • A dash display can provide the driver information such as lap times, RPMs, speed, gauge info, etc. • Data can be downloaded to computer for a detailed, second-by-second, corner-by-corner, lap-by-lap dissection of performance. • This data can be used for improving driver performance and to tune engine and suspension for better performance. • What follows is a more detailed discussion of basic techniques for analysis of data to improve driving technique.
GPS-Based Pros: Great portability/ease of installation Cons: Resolution? Systems: Racepak, Traqmate, Racetech... Speed Sensor/Beacon Pros: Better accuracy/repeatability (for data comparison) Cons: Harder to install Systems: AIM, Motec, Pi, Stack… Data System Comparison General considerations: Ease of comparing data with other drivers/cars is a plus; consider getting the same system as other drivers in your group/class to make this easier. Costs – starting at just under $1000 per. Make sure what sensors are included. Also – Dash display, predictive lap times, Math capabilities, CAN/OBD2 interface to ECU, ease of adding new/different sensors, # of channels, sampling rates, memory size
Who Makes them? GPS-based: http://www.g2xtreme.com/ - Racepak G2X http://www.traqmate.com/ - http://www.race-technology.com/ - Racetech DL1, DL1, etc. Sensor-based: http://www.aimsports.com/ - MyChron3/4, MXL http://www.motec.com.au/ - ADL2 http://www.stackltd.com/ - Stack Dash-Logger http://www.piresearch.com/ - X Sport, Delta, Sigma, etc.
Basic signals for evaluating driver performance: Speed RPM’s Lateral G’s Longitudinal G’s (accel/decel) With at least one or two of the above signals, we can start to draw some conclusions about what the driver’s doing, and what can be done better.
Additional signals for evaluating driver performance: Steering angle sensor Throttle position Brake pressure There are additional sensors that can be added to further indicate what the chassis is doing – yaw rate, shock potentiometers, etc – but these 3 are the more important driver feedback channels.
Strategy for Data Analysis • Find corners to improve, and find corners to not push harder on. • Take good notes. • At the track – don’t overdo data analysis. • Between weekends – look at more laps, look for patterns, find strong and weak points. • Don’t just look at the fastest lap from each session; review all your laps.
Guidelines • Filtering – be aware of filtering. • Get LOTS of data! • Consistency is key. • Make sure you’re hitting your marks. • Data systems only tell you what you’ve done, not what you can do: • be consistent • do something different - deliberately
Data evaluation • Review fastest laps. • Look for big obvious issues: • wheel spin on throttle • rough or ragged driving • lazy or over-aggressive corner entry • Off-line driving • Identify and evaluate areas of interest. • Find problem areas. • Look for consistency high and low points. • Detailed comparisons of lap time. • Take detailed notes, put them with your gear, and make sure they get to the track next time!!!
Data Analysis - Examples • Corner entry – too fast, too slow, good trail-braking • Recognizing oversteer • Recognizing understeer (?) • Friction Circle analysis • RPM data - Shift point evaluation • Car power (acceleration) comparison • Detailed comparison of lap times – statistical tools, lap time deviation from a baseline
Data Analysis – Basic lap plot This line Lateral G’s + RH - LH 0 G’s Corresponds to this point Speed
Data Analysis – Corner entry too fast – Turn 5 Lateral G peak at corner exit Car slows through corner
Data Analysis – Corner entry too fast – Turn 5 Compare speeds Earlier lateral G peak in grey lap: earlier turn-in Car exits corner faster
Data Analysis – Corner entry too slow – Esses Late lateral G peak at corner exit “Sawtooth” speed trace
Data Analysis – Corner entry too slow – Turns 1-2 Driver accelerates to apex
Data Analysis – Trailbraking technique – Paddock and Esses “Bowl-shaped” speed trace
Data Analysis – Recognizing Oversteer – Turn 3 Earlier turn-in on grey lap prevents oversteer No sliding!
Data Analysis – Recognizing Understeer – Turn 1-2 Tires give up, car stops turning here Lateral returns as steering returns Turn, baby, please!!!
Data Analysis – Preferred – Turn 5 Little bit of a slide here Corner entry: smooth transition from braking to cornering
The Friction Circle plots your lateral and longitudinal (accel/decel) Gs on one chart. • Easier side-by-side driver comparison.
Poor Trail Braking Good trail Braking (same car, different drivers) The greater the area, the more you are taking advantage of what grip your car has
This is very helpful to show trends in driving and what you need to change to improve. It also shows the problem is not the car but the device between the wheel and seat.
RPM eval – shift points – exiting Turn 2 to kink before Turn 3 Can this be avoided?
Spec Miata, two different cars – Turn 5 Look at the slope between cars – what is the red car doing differently?
Fastest lap of the race Lap times for each lap In your dreams! Green Blocks show segments that are faster than your fastest lap Segment Report. Are you consistent?
Lap Time statistical analysis Is this realistic? Is this?
Lap Time Comparison How do we do this again?
Summary • Focus on speed above all else. • Figure out where you’re good as well as where you’re bad. • Set achievable, measurable goals. • Waterford-specific thoughts – • Important corners for speed • “Throw-away” corners • High-risk corners Added thanks to Mark Dalen for his support and direction in putting this presentation together. Photo by Bubba Albo