Download
1 / 9
150 likes | 360 Views
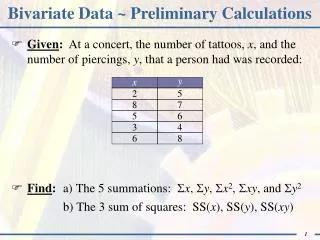
Intro to Bivariate Data. Presentation 2.1. Intro to Bivariate Data. Instead of just analyzing one variable at a time, we now investigate how to analyze how two variables may be related. The two variables are Explanatory Variable Response Variable. Explanatory Variable.

E N D
Intro to Bivariate Data Presentation 2.1
Intro to Bivariate Data • Instead of just analyzing one variable at a time, we now investigate how to analyze how two variables may be related. • The two variables are • Explanatory Variable • Response Variable
Explanatory Variable • The explanatory variable is the variable we use to explain the other. • This used to be called the independent variable. • When graphing the data, the explanatory variable is plotted along the X-axis.
Response Variable • The response variable is the variable we that measures our outcome. • It is in response to the explanatory variable. • This used to be called the dependent variable. • When graphing the data, the response variable is plotted along the Y-axis.
A Bivariate Example • At right is an example of a bivariate relationship. • The explanatory variable is: • Ice Cream Production • The response variable is: • Proportion of forcible rape • According to the data (which is authentic from the year 2000), how would you describe the relationship between the two variables?
A Bivariate Example • You may now see why bivariate data may be misunderstood more frequently than other areas in statistics. • We will revisit the ice cream vs. rape example again. • Continue thinking about a possible relationship.
Identifying the Variables • Sometimes it is clear that one of the variable is the explanatory and the other the response. • Sometimes, you’re not sure which should be which (as in the ice cream vs. rape example).
Identifying the VariablesFor each example below, decide which variable is which (or if it does not matter), then click to check your answer. • The amount of time spent studying for the test and the grade on the test. Explanatory: amount of time spent studying for the test • The yield of a crop and the amount of yearly rainfall. Explanatory: amount of yearly rainfall • A student’s grade in French and their grade in mathematics. Explanatory: either one – no natural distinction • Chance of being involved in an automobile accident and blood alcohol level. Explanatory: Blood alcohol level • A voter’s gender and their political party preference. Explanatory: the voter’s gender (notice variables are categorical)
Intro to Bivariate Data • This concludes this presentation.