Download
1 / 25
250 likes | 411 Views
Climate change in the Mediterranean area in Apulia. P.Lionello*, L.Congedi , M.Reale , L.Scarascia , A.Tanzarella. * Univ . Salento and CMCC. CLIMATE CONDITIONS IN THE DECADE 2001-2010. DYNAMICS OF THE CLIMATE SYSTEM . GHG CONCENTRATION, AEROSOLS, LANDUSE.

E N D
Climate change in the Mediterranean areain Apulia P.Lionello*, L.Congedi, M.Reale, L.Scarascia, A.Tanzarella * Univ. Salento and CMCC
CLIMATE CONDITIONS IN THE DECADE 2001-2010 DYNAMICS OF THE CLIMATESYSTEM GHG CONCENTRATION, AEROSOLS, LANDUSE CLIMATE CONDITIONS IN THE DECADE 2041-2050 DYNAMICS OF SOCIETIES AND ECOSYSTEMS CROPS PRODUCTIVITY, ENERGY DEMAND, WATER DEMAND, ECONOMIC SECTORS IN 2041-2050
PRESENT CLIMATE DYNAMICS OF THE CLIMATESYSTEM ANTHROPIC FACTORS FUTURE CLIMATE DYNAMICS OF SOCIETIES AND ECOSYSTEMS EFFECTS OF CLIMATE CHANGEON SOCIETIES AND ECOSYSTEMS
PRESENT CLIMATE DYNAMICS OF THE CLIMATESYSTEM FUTURE CLIMATE ANTHROPIC FACTORS DYNAMICS OF SOCIETIES AND ECOSYSTEMS EFFECTS OF CLIMATE CHANGEON SOCIETIES AND ECOSYSTEMS
Known with acceptable prognostic confidence on multi-decadal time scale PRESENT CLIMATE DYNAMICS OF THE CLIMATESYSTEM FUTURE CLIMATE ANTHROPIC FACTORS NOT known with acceptable prognostic confidence on multi-decadal time scale DYNAMICS OF SOCIETIES AND ECOSYSTEMS EFFECTS OF CLIMATE CHANGEON SOCIETIES AND ECOSYSTEMS
PRESENT CLIMATE DYNAMICS OF THE CLIMATESYSTEM ? STRONGLY nonlinear processes (limitedpredictability) FUTURE CLIMATE ANTHROPIC FACTORS DYNAMICS OF SOCIETIES AND ECOSYSTEMS EFFECTS OF CLIMATE CHANGEON SOCIETIES AND ECOSYSTEMS
ESTIMATE OF PRESENT CLIMATE CONDITIONS DYNAMICS OF THE CLIMATESYSTEM EMISSION SCENARIOS FUTURE CLIMATE PROJECTIONS DYNAMICS OF SOCIETIES AND ECOSYSTEMS SENSITIVITY OF CROPS PRODUCTIVITY, ENERGY DEMAND, WATER DEMAND, ECONOMIC SECTORS TO CLIMATE CHANGE
ESTIMATE OF CLIMATE CONDITIONS IN APULIA 1951-2050 DYNAMICS OF THE CLIMATESYSTEM EMISSION SCENARIOS CLIMATE PROJECTIONS IN APULIA 2021-2050 DYNAMICS OF SOCIETIES AND ECOSYSTEMS SENSITIVITY OF CROPS (OLIVES, GRAPEWINE,WHEAT) TO CLIMATE CHANGE
Lionello, P., Gacic, M., Gomis, D., Garcia-Herrera, R., Giorgi, F., Planton, S., Trigo, R., (...), Xoplaki, E. (2012) Program focuses on climate of the Mediterranean region Eos Trans. AGU 93:105-106 • 2nd MedCLIVAR book: THE CLIMATE OF THE MEDITERRANEAN REGION: FROM THE PAST TO THE FUTUREhttp://store.elsevier.com/The-Climate-of-the-Mediterranean-Region/isbn-9780124160422/
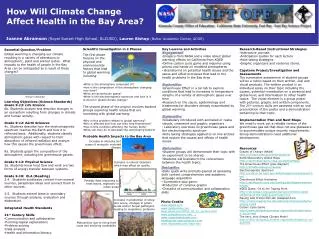
Figure 1: Köppen climate types in the Mediterranean region: subtropical Steppe (BSh), midlatitude steppe (BSk), subtropical desert (BWh), midlatitude desert (BWk), Mediterranean with hot/warm summer (Csa/b), Humid subtropical with no dry season (Cfa), Maritime temperate (Cfb), Humid continental with and hot/warm summer (Dfa/b), continental with dry hot/warm summer (Dsa/b), Tundra (ET). This figure is based on the CRU temperature and precipitation gridded data (New et al.2000)
Observedclimate trends Temperature trend oC/decade 1951-2005
temperature: Climate change A1B scenario,: Seasonal (DJF, MAM, JJA, SON) map of temperature (K) climate change (difference 2071-2100 minus 1961-1990) from an ensemble of GCMs. (adapted from Giorgi and Lionello, 2008).
precipitation: Climate change A1B scenario: Seasonal (DJF, MAM, JJA, SON) map seasonal precipitation (%) climate change (difference 2071-2100 minus 1961-1990) from an ensemble of GCMs. (adapted from Giorgi and Lionello, 2008).
MGME ensemble average, A1B scenario from Giorgi and Lionello, 2007
Annual average Tmax(a) and Tmin(b) for 11 individual Apulia stations (grey lines) and the average of the 11 stations in red (Tmax) and blue (Tmin). Linear trends are shown for the whole period 1951-2005 and 1976-2005 (black lines)
Trends of monthly mean Tmax (panels a and c) and Tmin (panels b and d) over Apulia (oC/year). Trends have been computed for the whole period 1951-2005 (panels a and b) and for the period 1976-2005 (panels c and d). Circles with increasing size denote trends statistically significant at the 90%, 95%, 99%, 99.9% levels. Vertical bars show the 1 to 99 percentile uncertainty range.
Total annual rainfall (mm) in Apulia for the period 1951-2005. The black line shows the overall regional mean (with its trend) and the colored lines correspond to the five areas in Figure 1b.
Trends of monthly rainfall (mm/year) for the whole period 1951-2005. Statistical significance does not reach the 90% confidence level for any month. Vertical bars show the 1 to 99 percentile uncertainty range as computed by the Mann-Kendall test statistics.
Linear regression between must and wine production (thousands of hl) and average seasonal temperature Tm (°C) in winter (a), spring (b) and summer (c) and total amount precipitation RR (mm) in spring (d) in Apulia for the period 1980-2005. Correlation with seasonal temperatures is significant at a confidence level larger than 90%. Correlation with spring RR is not significant.
Observed annual (black line) and estimated values (LRM, red line) in Apulia for must and wine (a, units =103 hl), harvested olives (b, units =103 tons), harvested wheat (c, units =103 tons)
LRM coefficients, intercept, coefficient of determination R2 and adjusted overall R2. Only seasonal values of mean temperature Tm and precipitation RR with statistically significant correlation at the 90% confidence level and used in the LRM are reported in this table. For olives, “RR spring” refers to the previous calendar year. Units of coefficients: for Tm versus wine 103 hl/oC, versus olive oil and wheat 103tons/oC, for RR versus olives and wheat 103 tons/mm). R2 and Radj2 values are denoted with ‘*’, ‘**’, ‘***’, ‘****’ for 90%, 95%, 99%, 99.9% significance level, respectively
Time series of annual (a) average (b) daily maximum (c) daily minimum temperature (°C), and (d) total annual precipitation (mm) for Apulia. Values are anomalies with respect to the mean baseline period 1961-1990. Lines show the CIRCE climate models: ENEA (pink), INGV (blue), MPI (green). The grey area is delimited by maximum and minimum values produced by the set of models used in the ENSEMBLES project and the red line represents their mean. The thick black line shows the time series of the observations
Trends of annual average temperature (a), maximum daily temperature (b), minimum daily temperature (c; °C/year), and total annual precipitation (d; mm/year) for Apulia. Values have been separately computed for the 1951-2000 (left bar of each pair) and 2001-2050 (right bar in each pair) periods. Bars show the CIRCE models and the mean of ENSEMBLES project simulations (red). Colors denote the level of statistical significance of trends (not significant, 90%, 95%, 99%, and 99.9%. The Mann-Kendall test has been used). In panels b, c, d the single bar on the right shows the observed trend in the period 1951-2000
Crop yield: wine (a, in thousand hl), harvested olives (b) and wheat (c, in thousand tons), simulated by the MLR model using climate data from three different CIRCE models for the period 1951-2049; ENEA (green), INGV (violet), MPI (red). In all panels, values are anomalies with respect to the 1961-1990 mean. percent variation of wine, olive oil and wheat production between the period 2021-2050 and 1961-1990. Negative values denote that future production will be lower. The first three columns are based on the results of the CIRCE project models, the fourth column on the mean of the ENSEMBLES project models
Conclusions Apulia meteorological stations shows trends towards warmer and marginally drier conditions during the second half of the 20th century. (Annual Tmin has warmed 0.18°C/decade. during the decades 1975-2005 annual Tmin has been increasing at 0.45°C/decade and Tmax at +0.47°C/decade, with a faster rate of increase during the summer. The detected decline in total annual RR-14.9mm/year and not significant for the period 1951-2005). Climate model projections suggest warmer and drier conditions over the next few decades. (During the second half of the 21st century average annual, minimum and maximum daily temperatures are projected to significantly increase with rates in the range from 0.35 to 0.6°C/decade and precipitation to decrease at a rate larger than 10mm/decade). The records of wine production, wheat and olive harvest present a statistically significant link to seasonal temperature and precipitation (seasonal variables explain a significant proportion of inter-annual variability: 40%, 18%, 9% for wine, harvested olives and wheat, respectively). Results suggest that wine production (-20÷-26%) and harvested olives (-8% ÷-19%) could be impacted in a negative way by the drier and hotter conditions characterizing Apulia in the first half of 21st century production, while harvested wheat (-4% ÷-1%) will be only marginally affected. This study does not actually aim at having a predictive skill, important factors and adaptation have been neglected, but to show likely future scenarios and potential critical sensitivity.