Download
1 / 17
180 likes | 388 Views
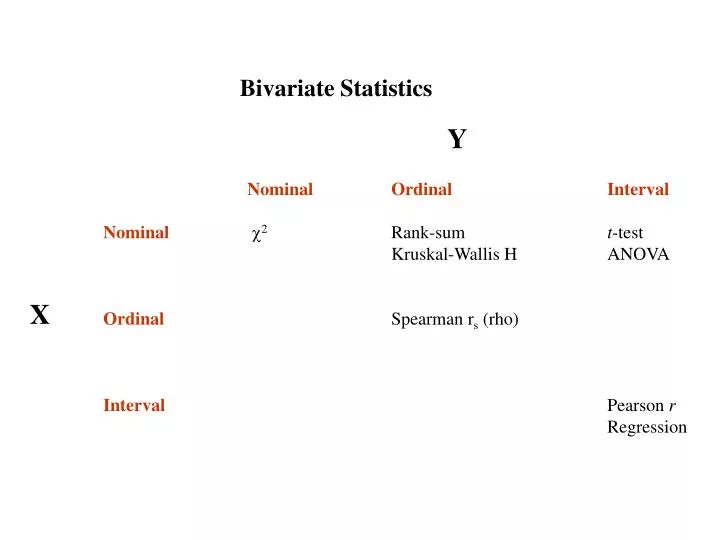
Bivariate Statistics. Y. Nominal Ordinal Interval Nominal 2 Rank-sum t -test Kruskal-Wallis H ANOVA Ordinal Spearman r s (rho) Interval Pearson r Regression. X. October 31. Sir Francis Galton. Karl Pearson. http://www.york.ac.uk/depts/maths/histstat/people/.

E N D
Bivariate Statistics Y Nominal Ordinal Interval Nominal2 Rank-sum t-test Kruskal-Wallis H ANOVA Ordinal Spearman rs (rho) Interval Pearson r Regression X
October 31 Sir Francis Galton Karl Pearson http://www.york.ac.uk/depts/maths/histstat/people/
Source: Raymond Fancher, Pioneers of Psychology. Norton, 1979.
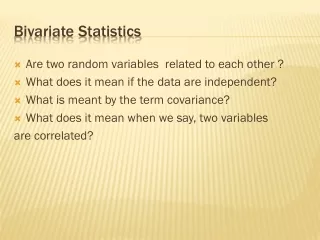
A correlation coefficient is a numerical expression of the degree of relationship between two continuous variables.
Pearson’s r -1 r +1 -1 +1
SampleC XC _ sc SampleD XD n _ sd Population n SampleB XB _ µ sb n SampleE XE SampleA XA _ _ se sa n n
SampleC SampleD rXY Population rXY SampleB XY rXY SampleE SampleA _ rXY rXY
Pearson’s r -1 r +1 -1 +1 Pearson’s r is a function of the sum of the cross-product of z-scoresfor x and y.
Pearson’s r zxzy r = N
SampleC SampleD rXY Population rXY SampleB XY rXY SampleE SampleA _ rXY rXY
r N - 2 t = 1 - r2 The familiar t distribution, at N-2 degrees of freedom, can be used to test the probability that the statistic r was drawn from a population with = 0 H0 : XY = 0 H1 : XY 0 where
Some uses of r • Association of two variables • Reliability estimates • Validity estimates
Factors that affect r • Non-linearity • Restriction of range / variability • Outliers • Reliability of measure / measurement error
Spearman’s Rank Order Correlation rs Point Biserial Correlation rpb
Pearson’s r -1 r +1 -1 +1 Pearson’s r can also be interpreted as how far the scores of Y individuals tend to deviate from the mean of X when they are expressed in standard deviation units.
Pearson’s r -1 r +1 -1 +1 Pearson’s r can also be interpreted as the expected value of zYgiven a value of zX. tend to deviate from the mean of X when they are expressed in standard deviation units. Theexpected value of zY is zX*r If you are predicting zY from zX where there is a perfect correlation (r=1.0), then zY=zX.. If the correlation is r=.5, then zY=.5zX.