Download
1 / 22
280 likes | 405 Views
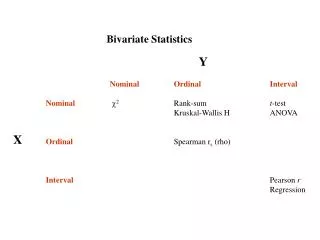
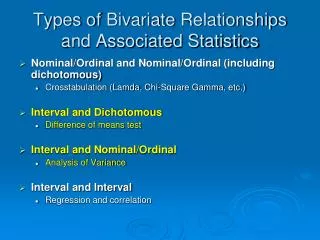
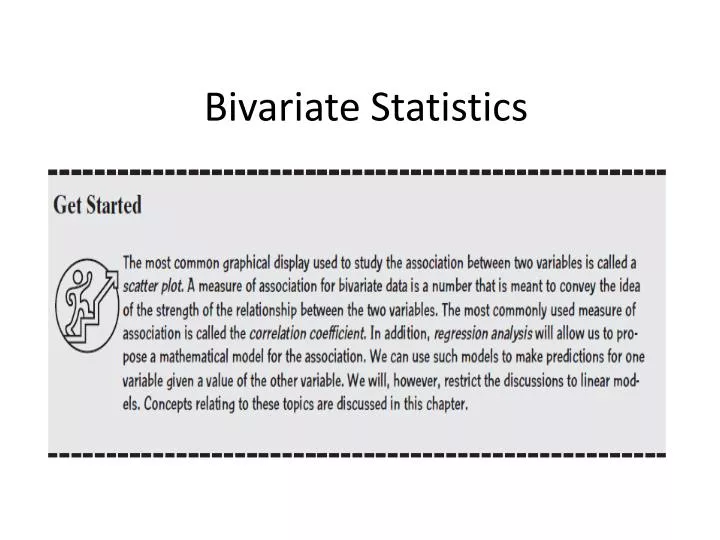
Bivariate Statistics. Dependent variable “Y”. Independent variable “X” . Dependent variable “Y” is said to be a function of independent variable “X”; i.e. Y = f(X). Scatter Plot Examples. Scatter Plot Examples (cont.). Scatter Plot Examples (cont.). Correlation Coefficient “r”.

E N D
Dependent variable “Y” Independent variable “X” Dependent variable “Y” is said to be a function of independent variable “X”; i.e. Y = f(X).
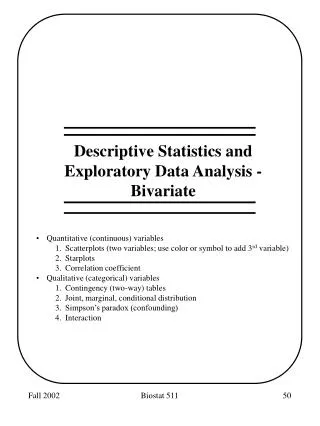
Correlation Coefficient “r” • “Correlation” is a statistical relationship between the X and Y variables. • The “Correlation Coefficient ‘r’” measures the strength and direction of a linear relationship between X and Y. (as notation, use “r” for sample data, and rho “ρ” for population data. The mathematical formula for “r” looks complicated, but MS Excel and all statistical software packages will calculate it for you.
Correlation and Causation • Direct cause-and-effect: • X causes Y. • Reverse cause-and-effect: • Y causes X. • Chance and coincidence: • Y and X happen to move in similar/opposite directions. • Confounding: • The relationship between X and Y actually involves other, perhaps several variables.
Calculating “a” and “b” * Once again, MS Excel or any statistical software package will calculate these for you automatically!