Download
1 / 23
230 likes | 356 Views
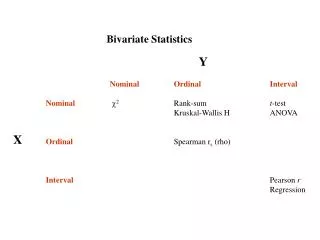
Minutes Exercised Per Day vs. Weighted GPA. Statistics Bivariate Analysis. By: Student 1, 2, 3. Why did we choose this study?. Exercise is a vital part of staying healthy and living an active and accomplished lifestyle.

E N D
Minutes Exercised Per Day vs. Weighted GPA Statistics Bivariate Analysis By: Student 1, 2, 3
Why did we choose this study? • Exercise is a vital part of staying healthy and living an active and accomplished lifestyle. • We believe that physical activity improves a student’s will to learn and may increase study habits. • Previous studies have concluded that children who live a more active lifestyle are more compelled to succeed in school. We want to see if this is true at our school. • We like to exercise, and we were curious to see if there is a correlation between these two variables.
Collected Data N=30
For X -X bar: 81.1 -Sx: 72.886 -5 # Summary: MinX: 0 Q1: 30 Med: 60 Q3: 120 MaxX: 240 For Y -Y bar: 3.494 -Sy: .3297 -5 # Summary: MinY: 2.6 Q1: 3.33 Med: 3.5 Q3: 3.7 MaxY: 4.3 Vital Stats
Outliers? In order to find outlier, we used the two formulas: • #<Q1-1.5(IQR) • #>Q3+1.5(IQR) • 0<30-1.5(90) • 240>120+1.5(90) • 0<-105 • 240>255 NO OUTLIERS • 2.6<3.33-1.5(.37) • 4.3>3.7=1.5(.37) • 2.6<-2.22 • 4.3>4.2554.3 is an OUTLIER
Histogram of X (exercise in min) The shape of the data is slightly right skewed.
Histogram of Y (Weighted GPA) The graph has a bell-shaped distribution. Outlier=4.5
Empirical Rule Test • Exercise (X) Mean=81.1 Standard Deviation=72.887 • 81.1 +/- 72.887= 153.986 & 8.213 • 81.1+/- 72.887(2)= 226.873 & -64.674 • 81.1 +/- 72.887(3)= 299.76 & -137.561 68% of the data falls between 153.986 & 8.213 95% of the data falls between 226.873 & -64.674 99.7% of the data falls between 299.76 & -137.561
Empirical Rule Test • GPA (Y) Mean= 3.494, Standard Deviation= .3297 • 3.494 +/- .3297 = 3.8237 & 3.1634 • 3.494 +/- .3297(2)= 4.1534 & 2.8346 • 3.494 +/- .3297(3)= 4.4831 & 2.5049 68% of the data falls between 3.8237 & 3.1634 95% of the data falls between 4.1534 & 2.8346 99.7% of the data falls between 4.4831 & 2.5049
Explanatory & Response Variable • The explanatory variable (X) in our data is the number of minuets exercised per day, it is used to predict changes in the response variable (Y) or GPA. • GPA is the response variable, and is dependent on the other data. This allows us to find a relationship between the two values.
Analysis • The Scatterplot shows that there is no linear correlation between exercise and weighted GPA due to the graph. In order to receive that conclusion, we know that when a correlation graph has a pattern it is linear. When the correlation graph does not have a pattern it is not linear. • The coefficient of correlation is r = -0.038168. This also gives another reason why the scatter plot is not linear. If the r value is closer to 1 then it is linear. If the r value rounds close to zero it is not linear. If the r value was close to one, it would be very strong but in this case the r value is not strong at all because it is closer to zero. The outlier in this scatter plot is 4.3 which slightly altered our data.
Regression Line on Scatterplot Equation: y= 3.508 + -.0002x
The y-intercept of the regression line gives the predicted value of y for any given value of x. • The slope shows the relationship between x and y as the steepness of the regression line is analyzed. • Our data does not prove a correlation between weighted GPA and average minutes exercise performed in a day, so this equation should not be used to predict the response variable.
R & R Squared • The r-squared value is explained variation over total variation and will give the accuracy (in a percentage) for a given value. • R2= .00145681è .14% of the variation in Y is explained by the variation in x. • R measures the strenght and direction of a linear relationshop between two variables • R= -.038168 negative, with no correlation.
Total Variation: is the sum of the y values minus the mean of y values, squared • 362595.172 • Explained Variation: is the sum of the y-hat values minus the mean of y values, squared • 181283.8495 • Unexplained Variation: is the sum of the y values minus the y-hat values • 181311.3225 • 362595.172= 181283.8495 + 181311.3225
y2 –b0y – b1xy se = n – 2 Standard Error of Estimate • The standard error of estimate is a measure of how sample points deviate from the regression line. Se measures the difference between the observed y-values and the predicted y-values. One would take the unexplained variable, divide that by the degree of freedom and square the result. Se= .3353
95% Prediction Interval • For X we choose: 70 • With wanting to find the possible GPA of a person with an average 70 minute workout, there will be a .3353 standard of error. The GPA would fall between 2.6889 and 4.0855.
Interpretation • The Residual plot shows that it is not a good model for the LSRL. This is because the plot contains a pattern and is in the negative range. In other words, this graph is not linear. On the residual plot, the X-values equals GPA weighted and the Y-values is exercise in minutes.
Conclusion • In conclusion, we have found that there is no correlation between how many minuets a high school student exercises, and their GPA. • Our graphs and data values are not strong enough to draw conclusions based on our sample. • Despite the amount of time that a student does or does not spend working out, their grades will neither increase or decrease.
Possible Problems • If the sample had been larger, the results may have been more accurate. • It is possible that subjects may have lied either about the amount they exercise or their true GPA, thus hindering our results. • It is sometimes difficult to estimate how much you exercise each day because it varies depending on your changing daily activities.