Download
1 / 17
170 likes | 174 Views
Assessment of Region 4 Riparian and Wetland Ecosystems. Max Smith, Katey Driscoll, Steve Warren, and Deborah Finch. Collaborators. Region 4 Mark Bethke Georgina Lampman Rocky Mountain Research Station Kate Dwire Dave Hawksworth National Forest staff. Process. Activities

E N D
Assessment of Region 4 Riparian and Wetland Ecosystems Max Smith, Katey Driscoll, Steve Warren, and Deborah Finch
Collaborators Region 4 • Mark Bethke • Georgina Lampman Rocky Mountain Research Station • Kate Dwire • Dave Hawksworth National Forest staff
Process Activities • Mapping, inventory, and assessment Questions answered • What resources are present? • Where are these resources? • Are they within the natural range of variability? Scale and extent • National Forests • Management areas • Landtype associations Time step • Forest plan revision schedule • Assessment revisionand publication
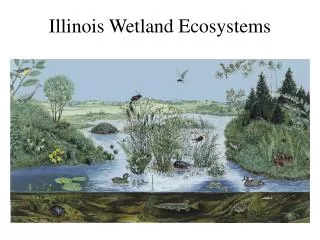
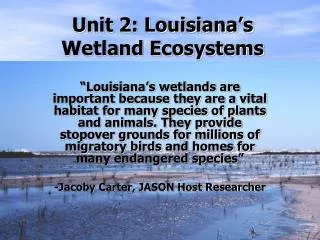
Key Ecosystem Characteristics • Distribution and connectivity of riparian ecosystems • Distribution of groundwater-dependent ecosystems • Surface and groundwater fluctuations • Water quality • Channel and floodplain dynamics • Spring runout channel dynamics • Composition and condition of riparian ecosystems • Composition and condition of GDEs
Data sources and analyses • LANDFIRE • Riparian Condition Assessment Tool (R-CAT) • Watershed Condition Framework (WCF) • PacFish/InFish Biological Opinion effectiveness monitoring (PIBO) • Best Management Practices monitoring (BMP) • Watershed Monitoring Program (WMP) • Hydro-geomorphic Valley Classification (HGVC)
Indicators • Conifer and upland encroachment (R-CAT) • Replacement by introduced vegetation (R-CAT) • Riparian and wetland condition (WCF) • Native/alien cover (PIBO) • Greenline/ground cover (PIBO) • Wetland index (PIBO) • Qualitative measures (WMP, BMP)
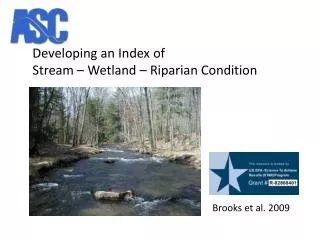
Data Sources and Analysis • Riparian Condition Assessment Tool (R-Cat) • USFS Terrestrial Condition Assessment • Proper Functioning Condition Reports
Indicators • Upland Encroachment • Perennial • Intermittent • Deviation in Winter Temperature • Deviation in Winter Precipitation
Conclusions • Identify primary stressors across the forest • Identify localized secondary stressors • Identify locations with multiple stressors • Identify stressors that tend to occur together • Identify Data Gaps
Implications • Ability to expand the current work • Progressing through Region 4 forest by forest • Method is flexible and adaptable depending on what data are available for each forest • Maintaining and Sharing Information • Publishing as a series of General Technical Reports • Compiling data, photographs, and literature and providing to forests • Opportunities for Collaboration with other forests and other regions • Strengths and Limitations • Directly applicable to Forest Plan Revision • Limited by data and literature that is already available • Lessons Learned • Forest visits, relationship building with on-the-ground folks is critical