Download
1 / 20
210 likes | 369 Views
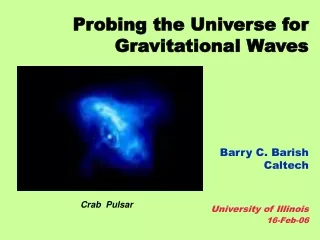
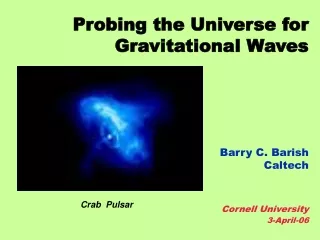
Measuring Dispersion in Signals from the Crab Pulsar. Jared Crossley National Radio Astronomy Observatory Tim Hankins & Jean Eilek New Mexico Tech. FORS Team, 8.2 m VLT, ESO. FORS Team, 8.2 m VLT, ESO. Michael Kramer (University of Manchester). Pulsar Basics.

E N D
Measuring Dispersion in Signals from the Crab Pulsar Jared Crossley National Radio Astronomy Observatory Tim Hankins & Jean Eilek New Mexico Tech FORS Team, 8.2 m VLT, ESO
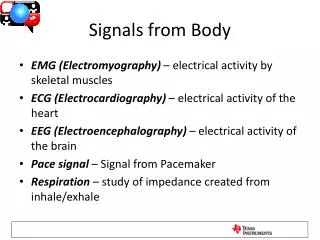
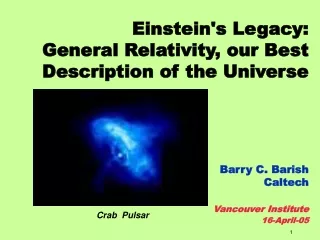
Michael Kramer (University of Manchester) Pulsar Basics • Pulsars are magnetized neutron stars that rotate rapidly • Magnetic field is a dipole (north and south pole) • Light is emitted in a beam from the magnetic poles • 1800+ pulsars have been found since 1968 Imagine the Universe! at NASA/GSFC
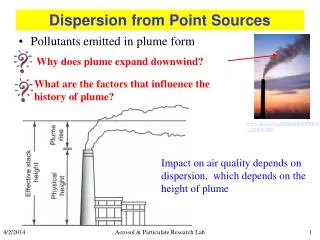
The Crab Pulsar is Unique • Only 6000 light years away • Only 956 years old • 2 pulses per rotation: “main pulse” and “interpulse” • Occasional very bright pulses -- over 1 million times brighter than average Very Bright pulses We can observe high-time-resolution single pulses
Dispersion • Dispersion = velocity of light depends on frequency • Radio wave propagation through ionized charges undergoes dispersion • For cold plasma, lower frequencies propagate slower • Measured using the time of arrival difference between pulses at two frequencies
Dispersion • Dispersion is important because: • It must be properly removed to see pulse structure in its original form • Tells us about the medium between pulsar and Earth • Previous studies have measured dispersion for pulse ensembles, averaged over minutes to hours of observation. • My research is a study of dispersion in single pulses, which occur on microsecond time scales. • We can now see how dispersion changes over very short times.
Observations Observed 20 days using Arecibo Radio Telescope, 2002 - 2007 Observed 9 days using Very Large Array,1993 and 1999 • We record data using customized “back-end” instrumentation for high time resolution measurements • Only the brightest pulses are recorded • Recorded pulses at observing frequencies 1 to 10 GHz
Measuring Dispersion Remove dispersion using avg-profile DM Cross-correlate pulses Measure the CCF-peak offset from zero-lag Offset ==> true DM Offset typically < 1 µs
Single pulse and Avg. profile DM Bright-pulse DM follows the same long-time-scale trend as average profile DM
Close up of DM vs. Time • Main pulse DM is closer to the avg-profile DM • Interpulse DM is larger and more scattered • Suggests interpulse has additional, variable dispersion
Main pulse Interpulse • DM scatter is larger than single pulse uncertainty • Interpulse DM scatter is larger than main pulse scatter • No systematic variation with time or pulsar phase Location: The pulsar magnetosphere - the region very close to the star - is the only place where variations occur this rapidly!
Interpulse DM Frequency Dependence Main pulse Interpulse Interpulse DM has a weak tendency to increase with frequency ==> suggests non-cold-plasma dispersion
Measure Alternative Dispersion Law • Two dispersion sources: • Assume magnetosphere dispersion is power law: x = 2 for cold plasma • Measure x using interpulse data: • Scatter in single-pulse DM data produces wide range of x.
Compare with Magnetosphere Model #1 • A strong radio wave ==> relativistic plasma motion ==> change in dispersion law • Index of refraction (Wu & Chian, 1995) convert to DM: • B depends on magnetospheric conditions • My data shows no correlation between DM and flux • Correlation may be hidden by DM variability from some other phenomena • I measure an upper limit onB to constrain magnetospheric conditions.
Compare with Magnetosphere Model #2 • Strong magnetic field ==> change in particle motion ==> change dispersion law • Index of refraction (Lyutikov & Parikh, 2000) ==> DMmag • Result: DMmag < 0 for all radio frequencies • My data shows the opposite: DMmag = DMIP > 0 This dispersion model does not apply to my data.
Dispersion Conclusions • Additional, variable interpulse dispersion, likely from magnetosphere • Compare interpulse DM with mag-sphere dispersion models: • Strong radio waves: • I find no correlation between DM and flux • Strong magnetic field: • Predicts less DM, but I see more DM
The Big Picture 2 • Variability shows that something changes on short scales. • This something cannot be in the interstellar medium ==> something is changing in the star • Differences between main pulse and interpulse ==> variability does not affect all emission • It may be localized within the magnetosphere
Next Steps • Additional observations • Good spectral coverage • Further constrain microburst bandwidth • Confirm or refute magnetospheric dispersion • Extend microburst study to interpulses • Better quantify the microburst flux-width upper limit • Archival data may reveal additional pulse echo events • New theory is needed to explain • New information from microburst study • Magnetospheric dispersion